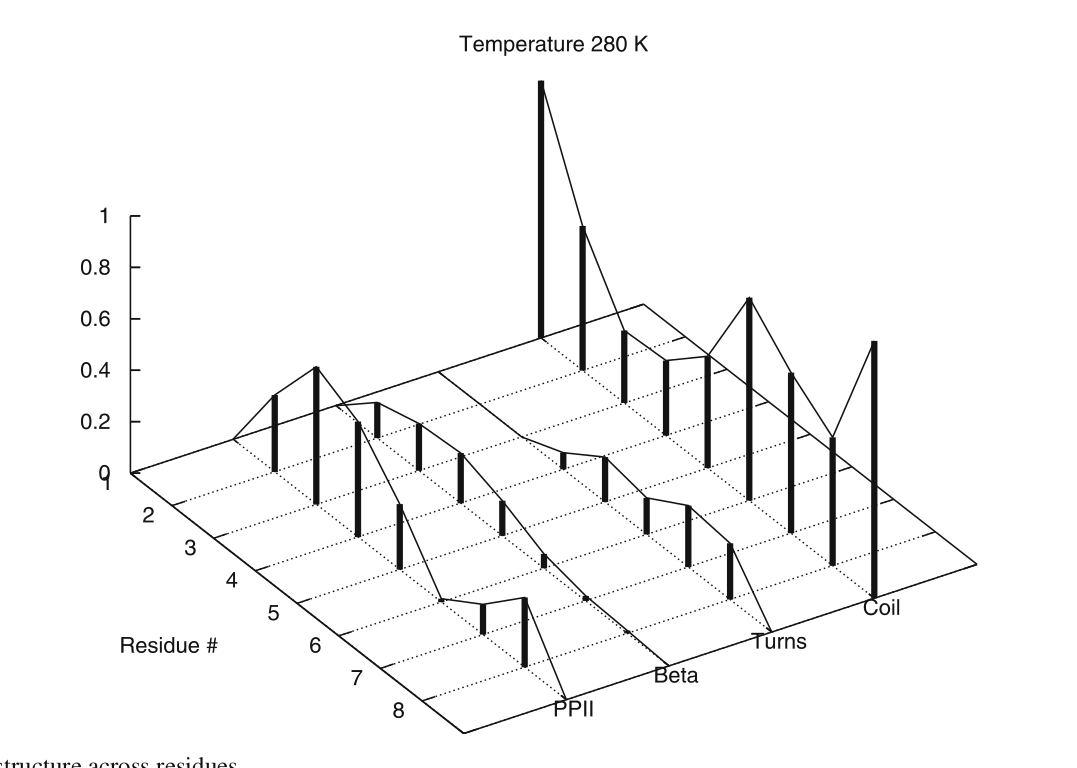
I need to make a plot like this below, any idea?
2 Answers
$\begingroup$
$\endgroup$
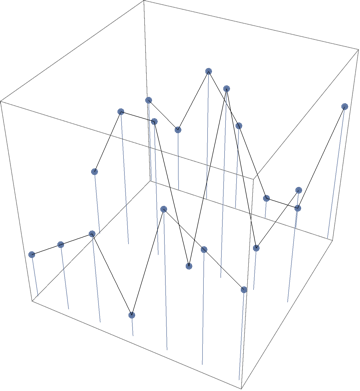
Modify, style and label as needed:
myData = {{3, 4, 5, 2, 7, 6, 5}, {4, 7, 7, 1, 9, 3, 6}, {5, 4, 7, 5, 2, 2, 7}};
lines = Graphics3D[
   Line /@ Table[{i, j, myData[[j, i]]}, {j, 1, 3}, {i, 1, 7}]];
Show[lines,
  ListPointPlot3D[myData,
  Filling -> Bottom],
  BoxRatios -> {1, 1, 1}
 ]
$\begingroup$
$\endgroup$
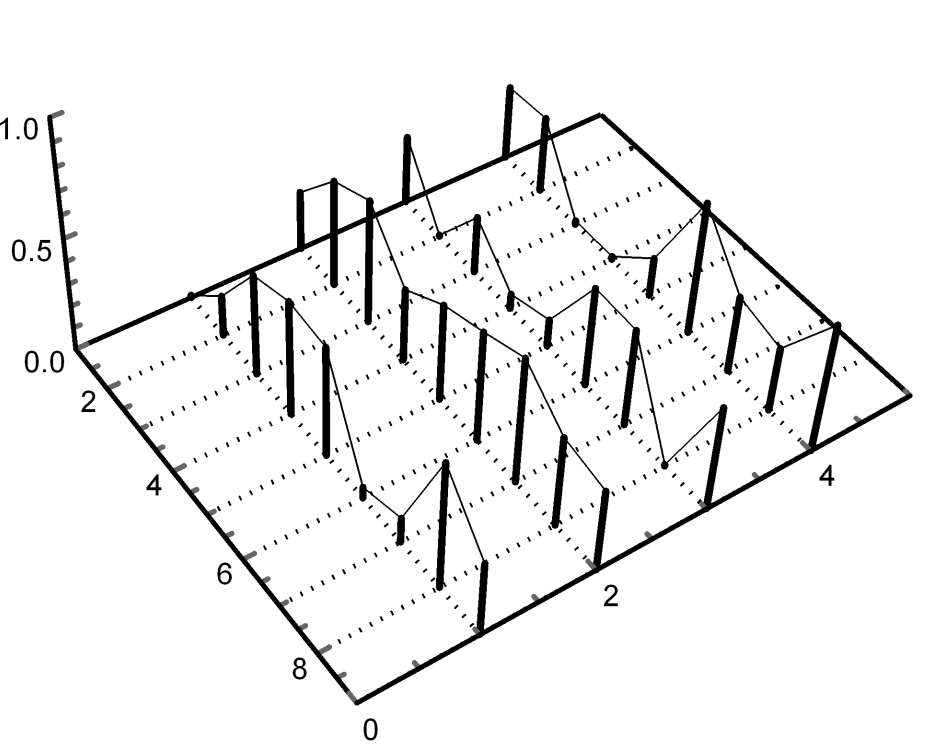
SeedRandom@22;
pts = Table[{i, j, RandomReal[0.6]}, {j, 4}, {i, 9}];

grid = Join @@ {Table[{{1, i, 0}, {9, i, 0}}, {i, 4}],
    Table[{{i, 0, 0}, {i, 5, 0}}, {i, 9}]};

 Graphics3D[{AbsoluteThickness@3,
   Line /@ ({{#1, #2, 0}, {##}} & @@@ Join @@ pts),
   AbsoluteThickness@1, Line /@ pts, Thick,
   Line[{{1, 0, 0}, {1, 5, 0}, {9, 5, 0}}], Dotted, Line /@ grid},
  BoxRatios -> {1, 1.3, 0.6}, Boxed -> False,
   Axes -> True,
  AxesStyle -> Directive[Black, Thick, 12],
  PlotRange -> {{1, 9}, {0, 5}, {0, 1}}]


