3
$\begingroup$

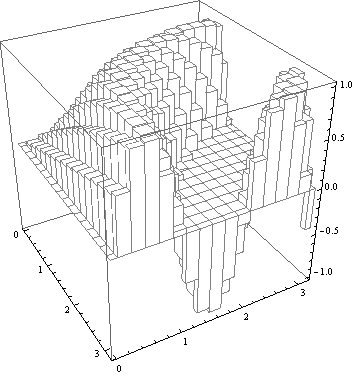
I want to plot a list of 3D points and make it look like this:
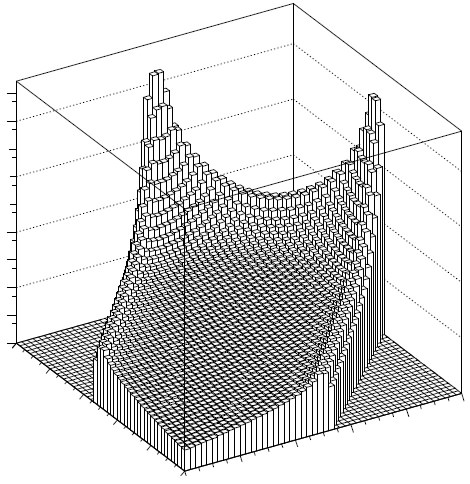
Discrete 3D Plot

where each value is represented by the height of a rectangular parallelepiped (with square top and bottom face).

As a simple example I'm using:

T=Flatten[Table[{x,y,Sin[x y]},{x,0,\[Pi]/2,\[Pi]/4},{y,0,\[Pi]/2,\[Pi]/4}],1];
ListPlot3D[T,InterpolationOrder->0,PlotTheme-> "Monochrome" ,Filling-> Bottom,BoundaryStyle->Directive[Black,Thick]]

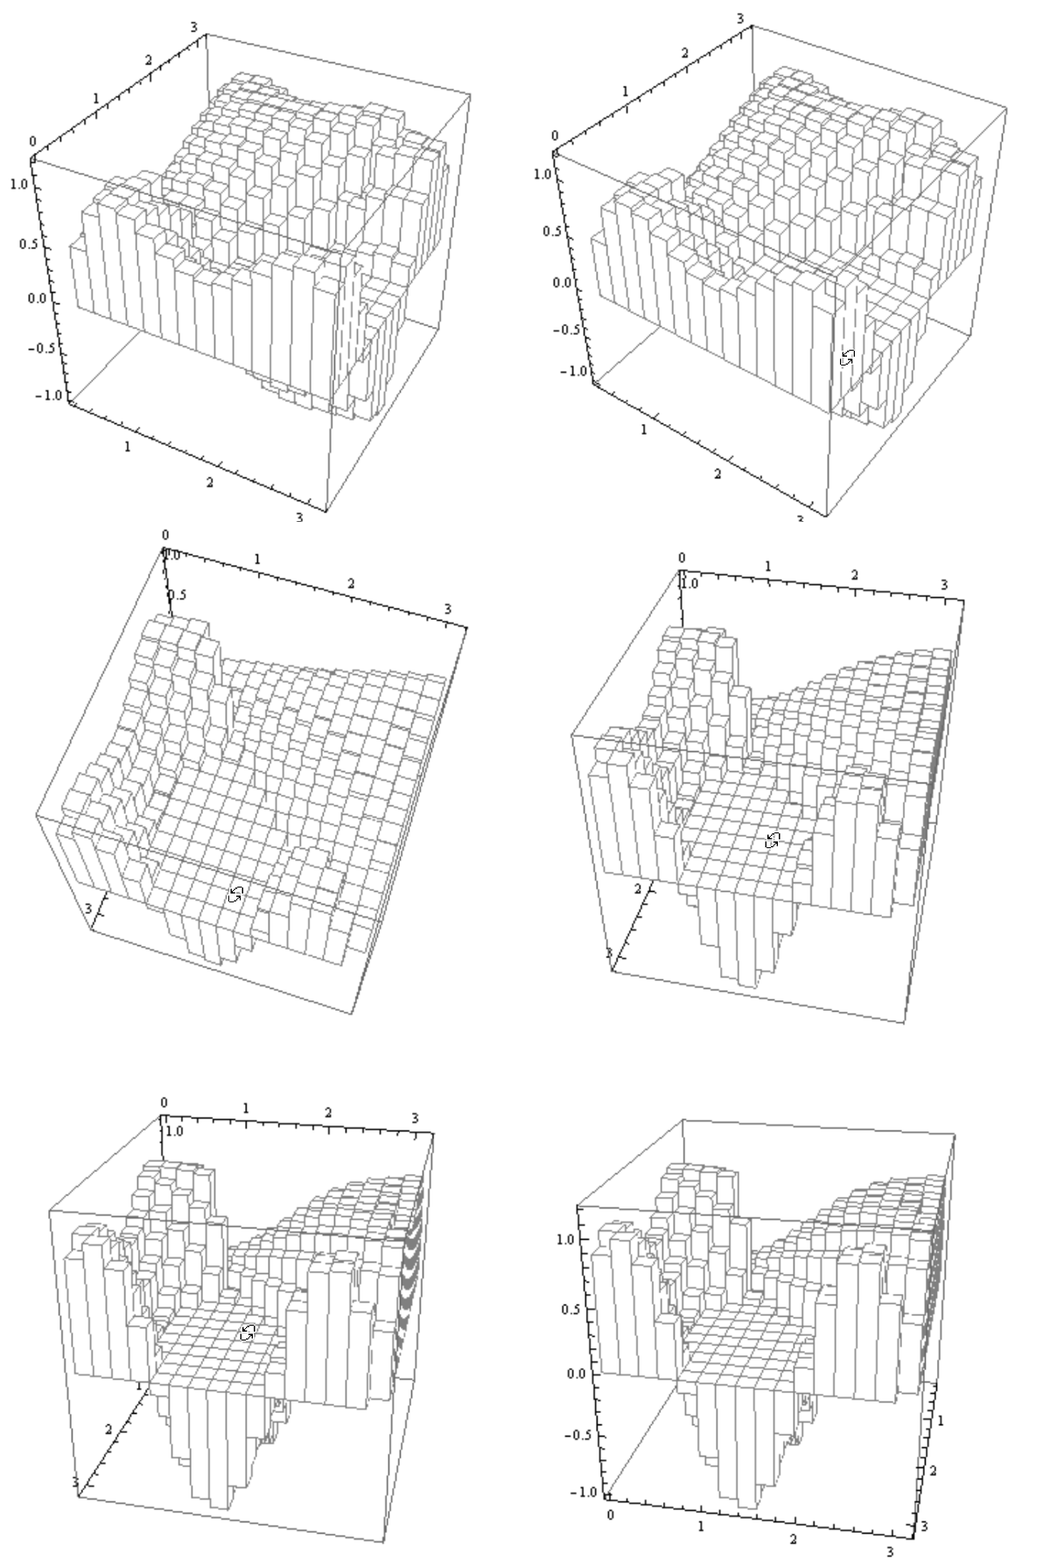
And got this:
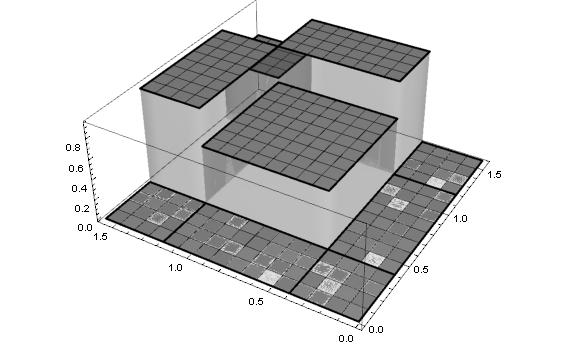
Example

which is much more complex than I wished. The plot dynamically changes color as I rotate it, the filling can be made 'solid' using FillingStyle and Opacity but it creates an homogeneous filling instead of having the vertical lines and simple white color on the sides.

Any idea?

Thanks

$\endgroup$
2
  • $\begingroup$ something like tT = Table[{x, y, Sin[x y]}, {x, 0, \[Pi], \[Pi]/16}, {y, 0, \[Pi], \[Pi]/16}]; BarChart3D[tT[[All, All, -1]], ChartLayout -> "Grid", BarSpacing -> {0, 0}, ColorFunction -> "Rainbow", "Canvas" -> False, "FaceGrids" -> None][[1]] // Graphics3D[#, Axes -> True, BoxRatios -> {1, 1, 1/GoldenRatio}] &? $\endgroup$
    – kglr
    Commented Jan 21, 2018 at 20:02
  • $\begingroup$ @kglr Thanks for your answer! It's really close to what I'm looking for. I wanted a simple white plot with black edges. I tried messing around with ColorFunction and ColorFunctionScaling but with no luck. Could you comment a little bit your code so I can understand what you did? $\endgroup$
    – Pierre
    Commented Jan 21, 2018 at 20:37

1 Answer 1

5
$\begingroup$
T = Flatten[Table[{x, y, Sin[x y]}, {x, 0, Pi, Pi /16}, {y, 0, Pi, Pi /16}], 1];

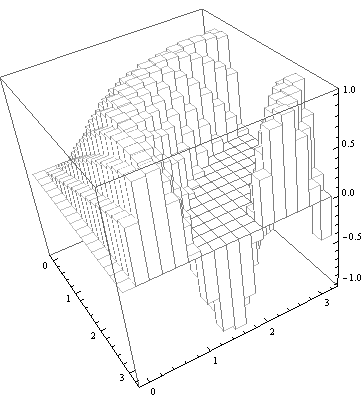
ListPlot3D

ListPlot3D[T, InterpolationOrder -> 0, Mesh -> All, 
 PlotStyle -> Directive[EdgeForm[Gray], FaceForm[Glow@White]], 
 FillingStyle -> Directive[EdgeForm[Gray], FaceForm[Glow@White]], 
 BoxRatios -> 1, Filling -> Axis]

enter image description here

Histogram3D

heights = Partition[T[[All, -1]], Sqrt[Length@T]];

Histogram3D[{{0, 0}}, {Range[0, Pi, Pi/16]}, (heights &), 
  ChartStyle -> Directive[EdgeForm[Gray], FaceForm[Glow @ White]], BoxRatios -> 1]

enter image description here

DiscretePlot3D

iF = Interpolation[T];
DiscretePlot3D[iF[x, y], {x, 0, Pi, Pi/16}, {y, 0, Pi, Pi/16}, 
 ExtentSize -> Full, BoxRatios -> 1, FillingStyle -> Opacity[1], 
 PlotStyle -> Directive[EdgeForm[Gray], FaceForm[{Opacity[1], Glow[White]}]]]

enter image description here

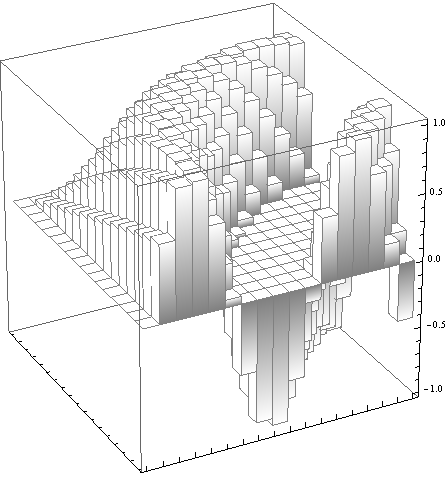
BarChart3D

BarChart3D[heights, ChartLayout -> "Grid", BarSpacing -> {0, 0}, 
 "Canvas" -> False, "FaceGrids" -> None, Boxed -> True, 
 ChartStyle -> White, PerformanceGoal -> "Speed", BoxRatios -> 1]

enter image description here

$\endgroup$
3
  • $\begingroup$ Saw your answer after I commented you comment. Let me take a look. $\endgroup$
    – Pierre
    Commented Jan 21, 2018 at 20:40
  • $\begingroup$ Thanks! It is very close to what I was looking for. I did think of using discrete plot after interpolating the list of points but it felt like cheating. It's really sad that ListPlot3D doesn't have an easy way out for this. $\endgroup$
    – Pierre
    Commented Jan 22, 2018 at 19:17
  • $\begingroup$ Pierre, Thank you for the accept. Added ListPlot3D. $\endgroup$
    – kglr
    Commented Jan 22, 2018 at 19:23

Your Answer

By clicking “Post Your Answer”, you agree to our terms of service and acknowledge you have read our privacy policy.

Not the answer you're looking for? Browse other questions tagged or ask your own question.