1
$\begingroup$

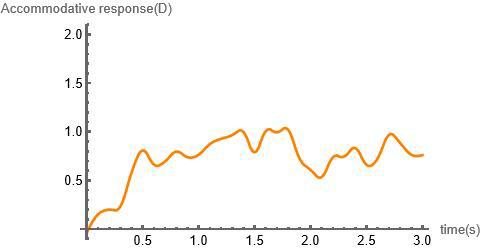
I have this data (where x is time (seconds) and y is diopters (D)):

j={{0.,-0.0404514},{0.1,0.149749},{0.2,0.198019},{0.3,0.233192},{0.4,0.579682},{0.5,0.806873}, {0.6, 0.663778},{0.7,0.696021},{0.8,0.79514},{0.9,0.738305},{1.,0.764991},{1.1,0.873105}, {1.2, 0.92797},{1.3,0.966118},{1.4,0.996534},{1.5,0.790578},{1.6,1.00572},{1.7,0.995352},{1.8,1.01874},{1.9,0.729424},{2.,0.606878},{2.1,0.536286},{2.2,0.737062},{2.3,0.745238},{2.4,0.831278},{2.5,0.661876},{2.6,0.727583},{2.7,0.966425},{2.8,0.885887},{2.9,0.764993},{3.,0.760021},{3.1,0.799975},{3.2,0.833339},{3.3,0.95302},{3.4,0.720215},{3.5,0.77478},{3.6,1.05699}}

enter image description here

How can I use fast fourier transform to divide into low (between 0 and 0.9 Hz) and high (between 1 and 2.1 Hz) frequency components and found mean power (D^2/Hz)?

Thank you so much.

$\endgroup$
5
  • 3
    $\begingroup$ You only have 37 points in your data. To get the mean power you need to average over many more points. Do you have more data? $\endgroup$
    – Hugh
    Commented Apr 27 at 15:01
  • 1
    $\begingroup$ Not only more data are needed, but also better time resolution $\endgroup$
    – Hans Olo
    Commented Apr 27 at 19:20
  • $\begingroup$ related $\endgroup$
    – andre314
    Commented Apr 28 at 7:39
  • $\begingroup$ related $\endgroup$
    – andre314
    Commented Apr 28 at 7:41
  • 1
    $\begingroup$ It's a signal processing problem, nearly unsolvable in your case. Don't expect Mathematica to do the expertise. "Fast Fourier" is a standard approach that people mainly choose only by ... mimetism. $\endgroup$
    – andre314
    Commented Apr 28 at 7:44

1 Answer 1

2
$\begingroup$

You do not need to "roll your own". MMA has the tools for this. You may use "LowpassFilter" and "HighpassFilter".

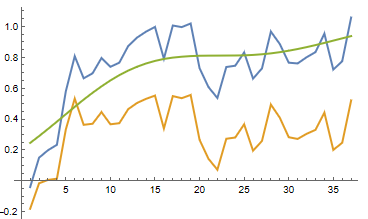
However, considering your data, a switching frequency of 1Hz seems way to low. This is obvious from:

freq = 1;
ListLinePlot[{j[[All, 2]], HighpassFilter[ys, freq, SampleRate -> 10],
   LowpassFilter[ys, freq, SampleRate -> 10]}]

enter image description here

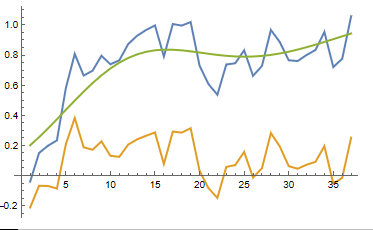
A frequency of 2 seems more appropriate:

freq = 2;
ListLinePlot[{j[[All, 2]], HighpassFilter[ys, freq, SampleRate -> 10],
   LowpassFilter[ys, freq, SampleRate -> 10]}]

enter image description here

$\endgroup$

Not the answer you're looking for? Browse other questions tagged or ask your own question.