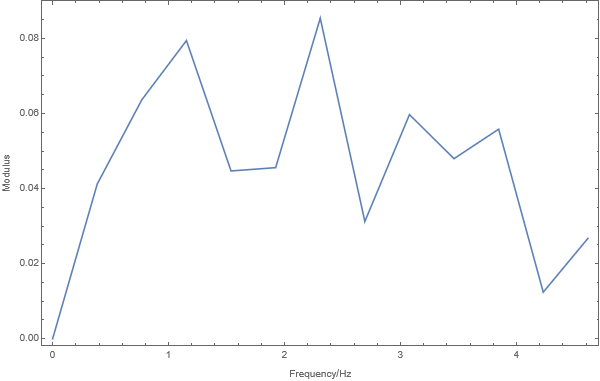
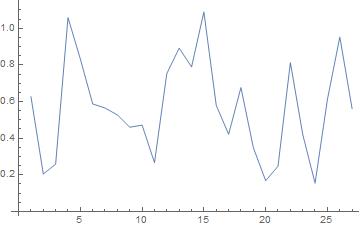
You have very few points. I don't think you want a power spectrum which implies some averaging. Instead let's look at the spectrum of the Fourier transform. First I identify some basic facts about your data.
sr = 1000./100; (* Sample rate *)
nn = Length@data; (* Number of points *)
m = Mean[data]; (* Mean of data values *)
Have I understood your sampling time correctly? I think you are sampling at 10 points per second.
The mean value is a nuisance when looking at frequency content because it produces a frequency component at 0 Hz. It is best to remove the mean value which I do next. Then I work out the frequency content of the data using Fourier. Finally I work out a frequency axis for your data.
d1 = data - m;
ft = Fourier[d1, FourierParameters -> {-1, 1}];
ff = Table[(n - 1) sr/(nn - 1), {n, nn}];
The spectrum calculated covers positive and negative frequencies. The negative frequencies are just a mirror image of the positive ones and can be ignored. See here for details of Fourier analysis. Now we can plot.
   ListLinePlot[Transpose[{ff, Abs[fd]}][[1 ;; (nn - 1)/2]],
 Frame -> True, FrameLabel -> {"Frequency/Hz", "Modulus"}]

As you can see you have very few data points and there is no particular split between low and high frequencies.
Can you get more data and post that? We would get a better spectrum then.
Hope that helps.


ts = TimeSeries@Transpose[{0.1*Range[0, Length[data] - 1], data}];, then usePowerSpectralDensity[ts, w]if that's what you mean by spectrum density, or you could usePeriodogram[data, SampleRate -> 10]andPeriodogramArray[data, SampleRate -> 10]. This has been asked a number of times before on this site. You'll need more data to get meaningful values: 27 samples is quite low. $\endgroup$