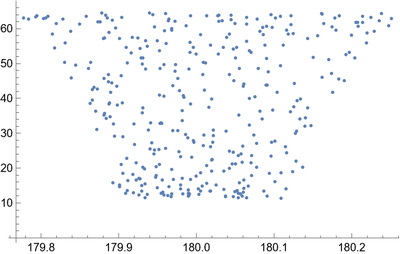
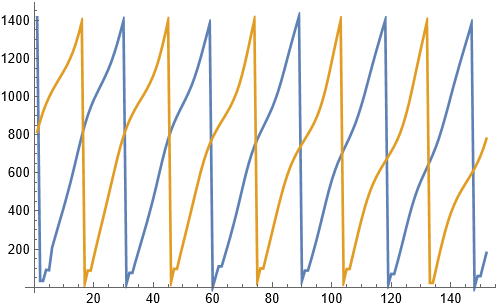
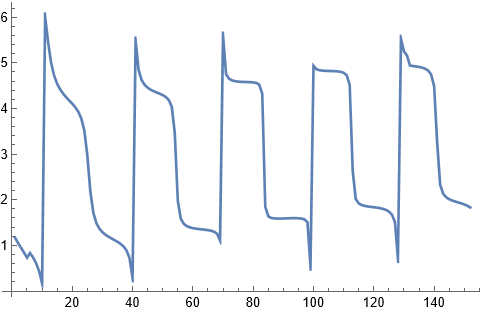
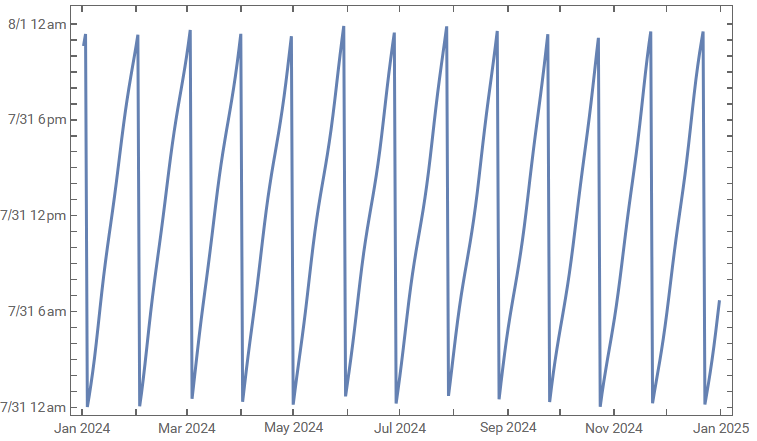
Mathematica provides "upper culmination" as the TransitTime property of PlanetaryMoon data. With the transit dates, we can get azimuth and altitude from MoonPosition.
The TransitTime property has two qualifiers for date and location. For example, let's use EntityValue and TransitTime qualifiers to find the Moon's transit time for October 2023 at Lowell Observatory, Flagstaff, Arizona, United States.
EntityValue[EntityProperty["PlanetaryMoon", "TransitTime"], "Qualifiers"]
(* {"Date", "Location"} *)
Let's get the rise, transit, and set times for location and dates in October 2023. First, use the rise times to find the following transit times, and then use the transit times to find the following set times. This gives us a sequence of rise time, transit time and set time for each date.
(*Lowell Observatory, Flagstaff, Arizona, United States*)
location = Entity["AstronomicalObservatory", "LowellFlagstaff"];
dates = DateRange[DateObject[{2023, 10, 1}], DateObject[{2023, 10, 30}]];

(*find next rise time for each date*)
r=EntityValue[Entity["PlanetaryMoon",  "Moon"],
 EntityProperty["PlanetaryMoon",
  "RiseTime", {"Date" -> #, "Location" -> location}]] &/@ dates;

(*find transit time following each rise time*)
t=EntityValue[Entity["PlanetaryMoon", "Moon"],
 EntityProperty["PlanetaryMoon",
  "TransitTime", {"Date" -> #, "Location" -> location}]] &/@ r;

(*find set time following each transit time*)
s=EntityValue[Entity["PlanetaryMoon",  "Moon"],
 EntityProperty["PlanetaryMoon",
  "SetTime", {"Date" -> #, "Location" -> location}]] &/@ t;
Demonstate that the transit times are not the midpoint of rise time and set times. The times are accurate to the nearest minute.
r + (s - r)/2 - t
(* {5 min, 4 min, 2 min, 0 min, 1 min, -2 min, -3 min, -4 min, -5 min, -5 min, -5 min, -5 min, -4 min, -4 min, -4 min, -4 min, -3 min, -3 min, -1 min, 0 min, 2 min, 3 min, 4 min, 5 min, 5 min, 5 min, 5 min, 5 min, 4 min, 3 min} *)
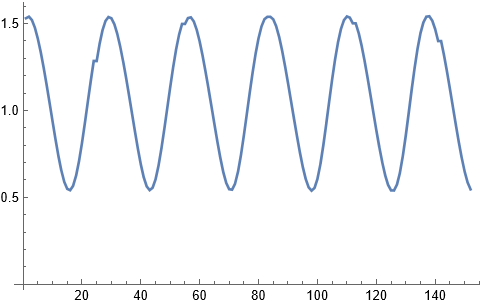
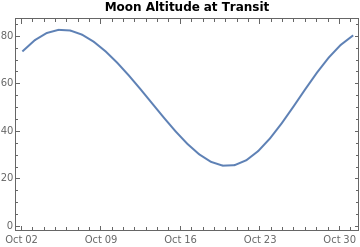
Use MoonPosition to get azimuths and altitudes for each transit time. The azimuths are close to 180 degrees but not equal because of the limited accuracy of the times. Use DateListPlot to graph the Moon's altitude at transit.
{azimuths,altitudes} = MoonPosition[location,t]["PathComponents"];
Through[{Mean, StandardDeviation}[azimuths]]
(* {180.04°, 0.195364°} *)

DateListPlot[altitudes,
  PlotLabel -> Style["Moon Altitude at Transit", Bold, Black]]
Display a table of rise, transit, and set times.
fmt = {"Day", " ", "MonthNameShort", " ", "Year", " ", "Time"};
TableForm[Transpose[{DateString[#, fmt[[;;-2]]] &/@ dates,
  DateString[#, fmt] &/@ r,
  DateString[#, fmt] &/@ t,
  DateString[#, fmt] &/@ s}],
TableHeadings -> {None, {"Date", "Next Rise", "Next Transit", "Next Set"}}]

