I'm pretty new to time series, but I'm now practising with it in order to obtain an exponential envelope of my experimental data. I start by importing data, I create the time series, I calculate the upper and lower estimated background (which is a time series itself), then I extract local maxima using FindPeaks and finally I try to use FindFit or NonlinearModelFit, but both of them give the same error: time component is not a valid variable.
On the other hand I don't understand how to use the command TimeSeriesModelFit to obtain an exponential fit.
t = Take[Transpose[data], 1];
p1 = Take[Transpose[data], -1];
ts1 = TimeSeries[p1, {t}, TemporalRegularity -> True];
eb1ts1 = EstimatedBackground[ts1, 100, Method -> {"SNIP", 1}];
eb2ts1 = -EstimatedBackground[-ts1, 50, Method -> {"SNIP", 1}];
max1 = FindPeaks[eb1ts1, 500];
max2 = FindPeaks[eb2ts1, 500];
FindFit[max1, A Exp[-t/(120 τ)] + B, {A, B, τ}, t]; OR
funfit[t_] := A E^(-(t/(120 τ))) + B;
fitmax = NonlinearModelFit[max1, funfit[t], {τ, A, B}, t, MaxIterations -> 100000]
I try this way.
{{1/120, -0.0209557}, {1/60, -0.0209557}, {1/40, -0.0209557}, {1/
  30, -0.019019}, {1/24, -0.0209557}, {1/20, -0.019019}, {7/
  120, -0.019019}, {1/15, -0.019019}, {3/40, -0.019019}, {1/
  12, -0.019019}, {11/120, -0.019019}, {1/10, -0.019019}, {13/
  120, -0.019019}, {7/60, -0.019019}, {1/8, -0.019019}, {2/
  15, -0.019019}, {17/120, -0.019019}, {3/20, -0.019019}, {19/
  120, -0.019019}, {1/6, -0.019019}, {7/40, -0.019019}, {11/
  60, -0.019019}, {23/120, -0.019019}, {1/5, -0.019019}, {5/
  24, -0.019019}, {13/60, -0.019019}, {9/40, -0.019019}, {7/
  30, -0.0170823}, {29/120, -0.0170823}, {1/4, -0.0170823}, {31/
  120, -0.0170823}, {4/15, -0.0170823}, {11/40, -0.019019}, {17/
  60, -0.0170823}, {7/24, -0.0170823}, {3/10, -0.0170823}, {37/
  120, -0.0170823}, {19/60, -0.019019}, {13/40, -0.019019}, {1/
  3, -0.019019}, {41/120, -0.019019}, {7/20, -0.019019}, {43/
  120, -0.019019}, {11/30, -0.019019}, {3/8, -0.019019}, {23/
  60, -0.019019}, {47/120, -0.019019}, {2/5, -0.019019}, {49/
  120, -0.019019}, {5/12, -0.019019}, {17/40, -0.019019}, {13/
  30, -0.019019}, {53/120, -0.019019}, {9/20, -0.019019}, {11/
  24, -0.019019}, {29/60, -0.0170823}, {59/120, -0.0170823}, {1/
  2, -0.019019}, {61/120, -0.019019}, {31/60, -0.019019}, {21/
  40, -0.019019}, {11/20, -0.0170823}, {67/120, -0.0170823}, {17/
  30, -0.019019}, {23/40, -0.019019}, {7/12, -0.019019}, {71/
  120, -0.019019}, {37/60, -0.019019}, {5/8, -0.019019}, {19/
  30, -0.019019}, {77/120, -0.019019}, {2/3, -0.019019}, {27/
  40, -0.019019}, {41/60, -0.019019}, {83/120, -0.019019}, {7/
  10, -0.019019}, {17/24, -0.019019}, {43/60, -0.019019}, {29/
  40, -0.019019}, {11/15, -0.019019}, {89/120, -0.019019}, {3/
  4, -0.0209557}, {91/120, -0.0209557}, {23/30, -0.0209557}, {31/
  40, -0.0209557}, {47/60, -0.0209557}, {19/24, -0.0209557}, {4/
  5, -0.019019}, {97/120, -0.019019}, {49/60, -0.019019}, {33/
  40, -0.019019}, {5/6, -0.019019}, {101/120, -0.019019}, {17/
  20, -0.0209557}, {103/120, -0.0209557}, {9/10, -0.0228924}, {109/
  120, -0.0228924}, {11/12, -0.0228924}, {37/40, -0.0228924}, {14/
  15, -0.0209557}}
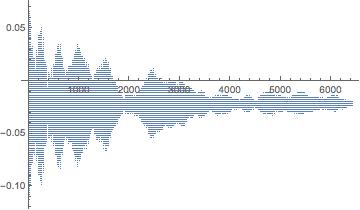
This is a plot of the overall data (position as a function of time=
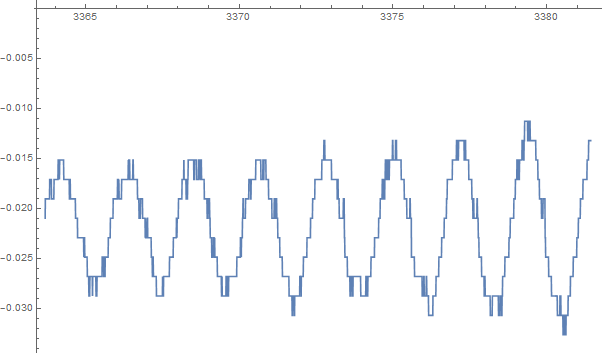
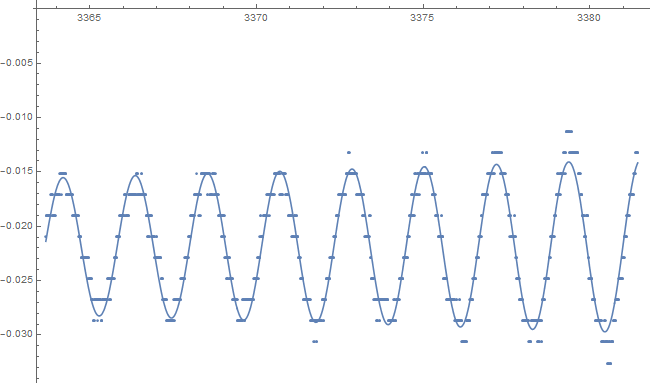
I'm interested in the damping phase, so in the second phase. The first phase is very short and cannot be even perceived in the overall plot. I would like to obtain an exponential envelop which show how fast the maximum oscillation amplitude goes to zero with respect to time. As you can see, the oscillation shows some beats; I would like to be able to select the local maxima of each beat and to "interpolate" those decreasing maxima with the best exponential.
Hello Hugh, I would like to follow your path in using NonlinearModelFit, but I don't know how to guess the initial parameter values. Is there a guideline to follow? Any practical hint you can provide in order to get closer to the correct ones? I appreciate your help.


data = Import["http://pastebin.com/raw/M03RMCJk", "List"]. $\endgroup$data = Import["http://pastebin.com/raw/M03RMCJk", "List"]from my notebook, I cannot import it properly (try it yourself and you'll see what I mean). I was asking if you could arrange that, either but changing the style of the uploaded data, or by providing a command to import it straightforwardly. $\endgroup$