1
$\begingroup$

I want to plot a straight line perpendicular to the $x$-axis at $x=1$. None of the following attempts work:

Plot[EvenQ[x == 1], {x, -1, 2}]
Plot[x == 1, {x, -1, 2}]
Plot[1, {x, -1, 2}]

I have only managed to do it with ContourPlot:

ContourPlot[Evaluate[x == 1], {x, -1, 2}, {y, -1, 2}, Axes -> True]

How can I use Plot command to draw a straight line perpendicular to the x-axis?

$\endgroup$
2
  • 2
    $\begingroup$ maybe Plot[x, {x, -1, 2}, GridLines -> {{1}, None}, GridLinesStyle -> Directive[Red, Dashed, Thick]]? $\endgroup$
    – kglr
    Commented Jan 30 at 3:42
  • 1
    $\begingroup$ Also, ParametricPlot[{1, x}, {x, -1, 1}]. $\endgroup$
    – march
    Commented Jan 30 at 4:57

4 Answers 4

4
$\begingroup$

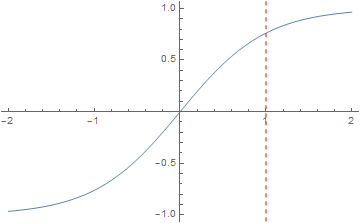
Using InfiniteLine: (2nd syntax variation)

If you application requires adding lines only, this should be okay.

Plot[Tanh[x], {x, -2, 2}
 , Epilog -> {
   Dashed, Red
   , InfiniteLine[{1, 0}, {0, 1}]
   }
 ]

Using ContourPlot:

Much more flexible, as any implicit equation can be plotted with the following method.

Show[
 Plot[Tanh[x], {x, -2, 2}]
 , ContourPlot[x == 1
  , {x, -2, 2}, {y, -2, 2}
  , ContourStyle -> {Dashed, Red}
  ]
 ]

Result:

enter image description here

$\endgroup$
5
$\begingroup$

May be Epilog?

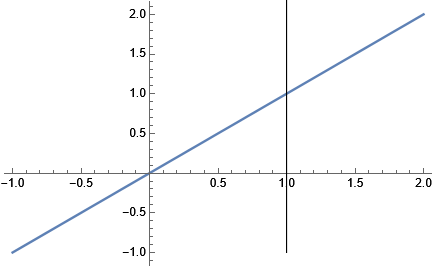
Plot[x, {x, -1, 2}, Epilog -> Line[{{1, -1}, {1, 3}}]]

gives

Mathematica graphics

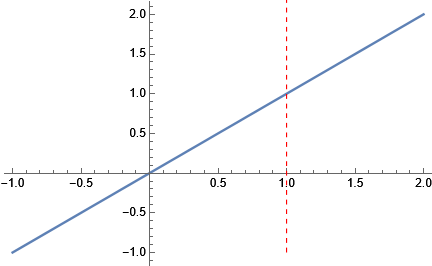
You can change the style as needed. For example

Plot[x, {x, -1, 2}, Epilog -> {Dashed, Red, Line[{{1, -1}, {1, 3}}]}]

Mathematica graphics

$\endgroup$
2
$\begingroup$

Try

Show[
  Plot[x^2+1/2,{x,-2,2}],
  ListPlot[{{1,0},{1,4}},Joined->True]
]
$\endgroup$
1
$\begingroup$

As mentioned in the comments:

Plot[x, {x, -1, 2}, GridLines -> {{1}, {}}, GridLinesStyle -> Directive[Red, Dashed]]
$\endgroup$

Your Answer

By clicking “Post Your Answer”, you agree to our terms of service and acknowledge you have read our privacy policy.

Not the answer you're looking for? Browse other questions tagged or ask your own question.