My friend, what you ask for is madness. Assuming you're completely aware of just doing this, or similar:
Show[
 PolarPlot[{4/Cos[theta], 4/Sin[theta]}, {theta, -6, 6}],
 Graphics[Rotate[Line[500 {{-1, 0}, {1, 0}}], Pi/3]]]
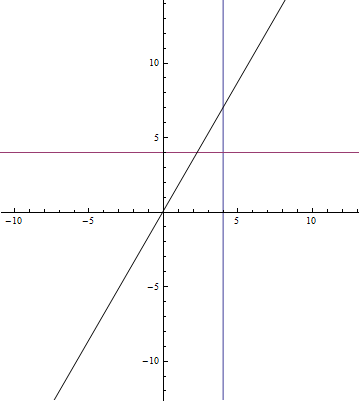
Here's the most obvious brute-force mickey mouse approach:
PolarPlot[{4/Cos[theta], 4/Sin[theta], Evaluate[
   If[Pi/3 < theta < Pi/3 + 4/(2 Pi Abs[#]), #] & /@
    Range[-30, 30, .717]
   ]}, {theta, -6, 6}, PlotRange -> 40, PlotPoints -> 400,
 PlotStyle -> {{Thickness[.01]}, {Thickness[.01]}, Thickness[.01]}]
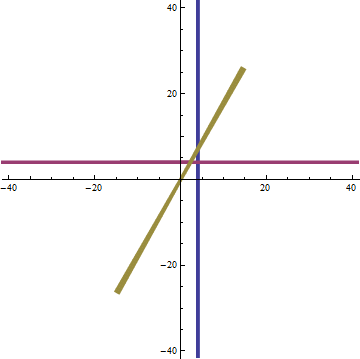
Exchanging some accuracy for performance:
PolarPlot[{4/Cos[theta], 4/Sin[theta],
  If[Pi/3 < theta < Pi/3 + .03, Range[-30, 30, .717]]
  }, {theta, -6, 6}, PlotRange -> 40, PlotPoints -> 400,
 PlotStyle -> {Thickness[.01], Thickness[.01], Thickness[.01]}]
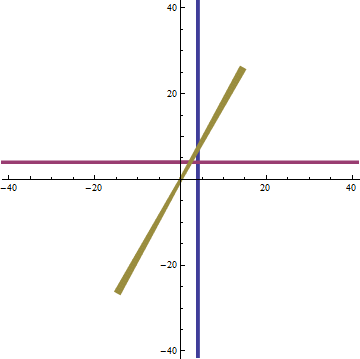
I mention these to show how arbitrary your functions in Plots can be.
Here's one implementation of @Jonathan's idea:
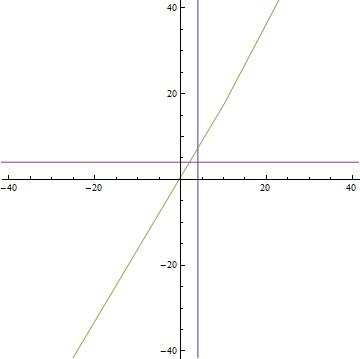
PolarPlot[{4/Cos[theta], 4/Sin[theta], .2/(theta - Pi/3)},
 {theta, -2.1 Pi, 2.1 Pi}, PlotRange -> 40]
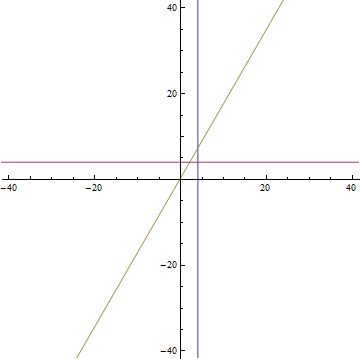
Another, flakier version:
PolarPlot[{4/Cos[theta], 4/Sin[theta], 10000 (theta - Pi/3)},
 {theta, -2.1 Pi, 2.1 Pi}, PlotRange -> 40]


Plot[]?" $\endgroup$(0,0)and then increase the radius until it looks like you want it to. $\endgroup$Epilog->{Line@{{x0,y0},{x1,y1}}at the end ofPolarPlotoptions list $\endgroup$