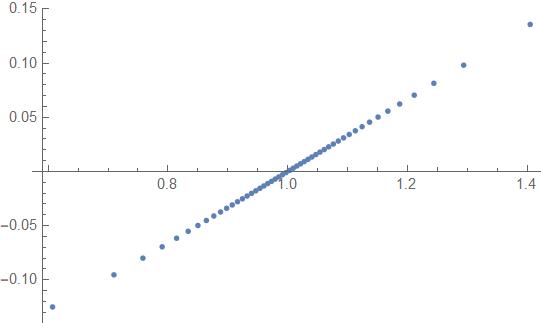
I have these point
p = {1.4048301787418027` + 0.13589831076513692` I, 1.2937864859657142` + 0.09826442126033227` I, 1.2439169436341522` + 0.08152085090585755` I, 1.2112251127756706` + 0.07057066521001881` I, 1.1867797359572914` + 0.06239213624408477` I, 1.1671819237029237` + 0.05584007186977612` I, 1.1507678762649645` + 0.050355104251339586` I, 1.1365972662436867` + 0.04562153217223474` I, 1.124085953294084` + 0.041443428931470704` I, 1.1128457075115394` + 0.037690672840169796` I, 1.1026049923874517` + 0.034272306091684974` I, 1.0931660902037226` + 0.031122129476503592` I, 1.0843802257181003` + 0.028190350543236032` I, 1.076132312976041` + 0.025438465710119672` I, 1.0683311706306955` + 0.02283597890972666` I, 1.060903003028386` + 0.020358216403672635` I, 1.053786913489549` + 0.017984823404026413` I, 1.0469317264511402` + 0.015698699656082248` I, 1.0402936772643052` + 0.013485225924340693` I, 1.0338346910665444` + 0.011331687936209292` I, 1.027521069271944` + 0.009226836941693186` I, 1.021322461994918` + 0.007160546106256114` I, 1.0152110424227831` + 0.0051235346034142525` I, 1.0091608233679767` + 0.003107139398530981` I, 1.0031470719276647` + 0.0011031199836812119` I, 0.9971457882879402` - 0.0008965152800982101` I, 0.9911332209734355` - 0.0028996704469104913` I, 0.9850853942726508` - 0.004914318965930066` I, 0.9789776246938359` - 0.006948664028432134` I, 0.9727840022953297` - 0.009011310260944524` I, 0.9664768094358419` - 0.011111455803159562` I, 0.9600258433964858` - 0.013259115782829277` I, 0.9533975994565845` - 0.015465391402985825` I, 0.9465542556662075` - 0.017742803834833825` I, 0.9394523769004093` - 0.02010571977953537` I, 0.9320412189796319` - 0.022570907472936778` I, 0.9242604553685143` - 0.025158280726805794` I, 0.9160370544286163` - 0.027891919050845516` I, 0.9072808772098193` - 0.030801502627903685` I, 0.8978782922954255` - 0.03392438838789599` I, 0.8876826109570178` - 0.037308710478383814` I, 0.8764992119353089` - 0.041018184124120435` I, 0.864061351522674` - 0.045139880920104784` I, 0.8499886226970275` - 0.04979749980583017` I, 0.8337105619927074` - 0.05517557183546196` I, 0.814313066911355` - 0.06156755652317412` I, 0.7901896657264539` - 0.0694831242611486` I, 0.7580949362489926` - 0.07993065003390927` I, 0.7096897586662804` - 0.09538398209765551` I, 0.6071597345880032` - 0.1250060626682752` I}
Now I did
sol = FindFit[p, a x + b, {a, b}, x];
eqnR[x_] := a x + b /. sol;
eqnR[x]
Which gives me the output
(1.24601 + 0.0818429 I) - (0.00962482 + 0.00319108 I) x
I want to plot the list plot by doing
ListPlot[Transpose[{Re[p],Im[p]}]]
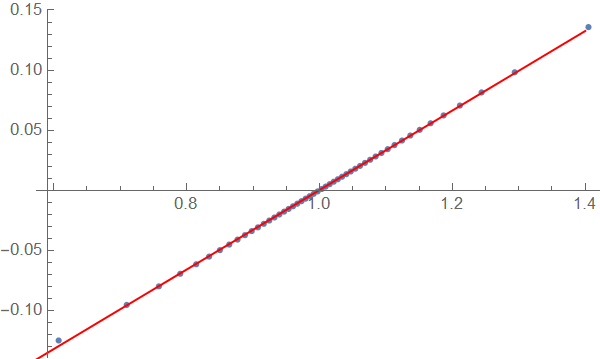
and also plot the straight line from the find-fit given by eqnR[x] on the same plot.
But I am not sure how to plot a straight line with complex parameters. Any suggestions?
This is the list plot. What I would like to have is a plot of straight-line fitting all these points.


