3
$\begingroup$

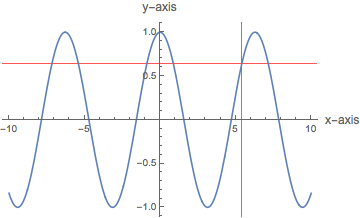
I have some plot like the following:

Plot[Cos[x], {x, -10, 10}, AxesLabel -> {Style["x-axis", 12], Style["y-axis", 12]}, ImageSize -> {650, 650}]

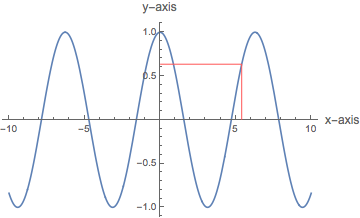
I'd like to be able to specify a point along the x-axis and draw a line of some color from this point to a point immediately above or below it falling along the given curve, and then draw a line from this point on the curve to a point immediately to the left or right of the point on the curve to a point on the y-axis (wherever either of these two axes are positioned). Is there a built-in way to do this in Mathematica 9?

The purpose of this is to make it obvious where a point p on the curve falls along the x-axis and y-axis in the plot.

$\endgroup$
1
  • $\begingroup$ Welcome to Mathematica.SE! I suggest the following: 1) As you receive help, try to give it too, by answering questions in your area of expertise. 2) Read the faq! 3) When you see good questions and answers, vote them up by clicking the gray triangles, because the credibility of the system is based on the reputation gained by users sharing their knowledge. Also, please remember to accept the answer, if any, that solves your problem, by clicking the checkmark sign! $\endgroup$
    – user9660
    Commented Mar 11, 2015 at 18:40

1 Answer 1

8
$\begingroup$

Like this, Epilog?

With[{expr = Cos[x], x0 = 5.4}, 
 Plot[expr, {x, -10, 10}, 
  AxesLabel -> {Style["x-axis", 12], Style["y-axis", 12]}, 
  ImageSize -> {650, 650},
  Epilog -> {Lighter@Red, 
    Line[{{x0, 0}, {x0, expr /. x -> x0}, {0, expr /. x -> x0}}]}]
 ]

Mathematica graphics

Or perhaps with GridLines?

With[{expr = Cos[x], x0 = 5.4}, 
 Plot[expr, {x, -10, 10}, 
  AxesLabel -> {Style["x-axis", 12], Style["y-axis", 12]}, 
  ImageSize -> {650, 650},
  GridLines -> {{x0}, {expr /. x -> x0}},
  GridLinesStyle -> Lighter@Red]
 ]

Mathematica graphics

$\endgroup$

Your Answer

By clicking “Post Your Answer”, you agree to our terms of service and acknowledge you have read our privacy policy.