1
$\begingroup$

The following FunctionRange

(*a=((1-x) y)/(1-y z)*)
FunctionRange[{{((1 - x) y)/(1 - y z)}, 0 <= x <= 1, y > 1, 
   0 < z < 1}, {x}, a, Reals] // Simplify

returns

y > 1 && z < 1 && z > 0 && y z != 1 && a y z <= a && a <= y + a y z

I'm struggling to see how to illustrate/plot (in 2D or 3D) the values of x, y, z that are excluded and the resulting values for a that are excluded.

Appreciate any hints or tips.

$\endgroup$
2
  • 1
    $\begingroup$ Maybe result = FunctionRange[{((1 - x) y)/(1 - y z), 0 <= x <= 1, y > 1, 0 < z < 1}, {x}, a, Reals]; Reduce[result, a] $\endgroup$
    – cvgmt
    Commented Aug 27, 2023 at 21:55
  • $\begingroup$ Apologies for the ambiguity. I've clarified the OP. What I meant by "illustrate the values" is some type of plot, 2D or 3D $\endgroup$
    – Hedgehog
    Commented Aug 27, 2023 at 22:01

2 Answers 2

1
$\begingroup$
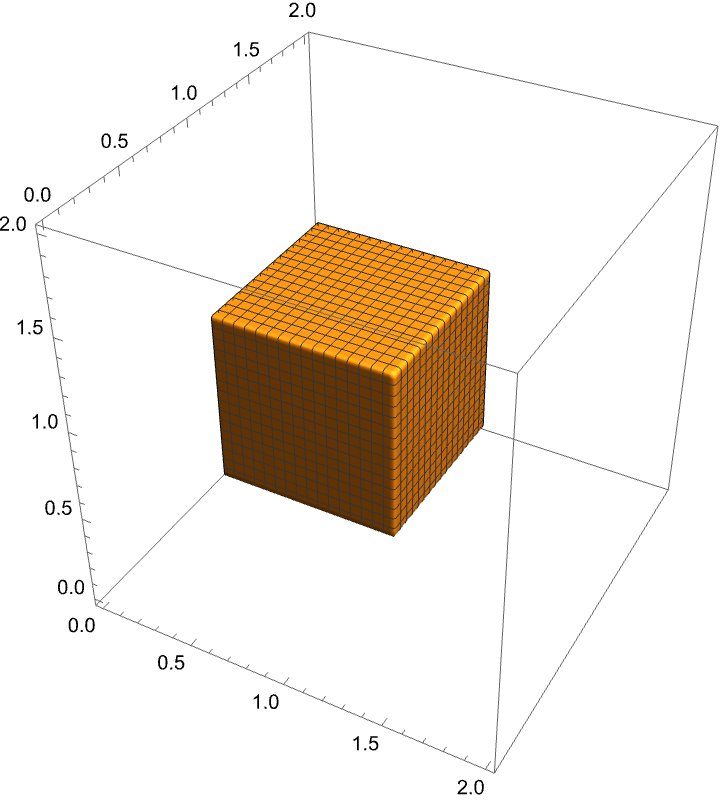
a = ((1 - x) y)/(1 - y z);
RegionPlot3D[
 y > 1 && z < 1 && z > 0 && y z != 1 && a y z <= a && a <= y + a y z,
 {x, 0, 2}, {y, 0, 2}, {z, 0, 2},
 PlotPoints -> 100]

enter image description here

$\endgroup$
1
  • $\begingroup$ Thanks, that led me to, what I believe is, the end result I was after. $\endgroup$
    – Hedgehog
    Commented Aug 28, 2023 at 3:33
1
$\begingroup$

If I understand correctly the following is the program:

  1. Calculate the FunctionRange in terms of the function a for one of the variables.
  2. Use Reduce to obtain a form suitable for plotting (HT: @cvgmt)
  3. Replace a to return to the original variables
  4. Again Reduce and then
  5. Plot the complement of the constraints using RegionPlot3D (HT: @david-p-stork)
  6. Some sort of color scale to show the values of a...
(*step 1*)
result = 
 FunctionRange[{((1 - x) y)/(1 - y z), 0 <= x <= 1, y > 1, 
   0 < z < 1}, {x}, a, Reals]
(*step 2, 3 and 4*)
r = Reduce[Reduce[result, a] /. a -> ((1 - x) y)/(1 - y z)]
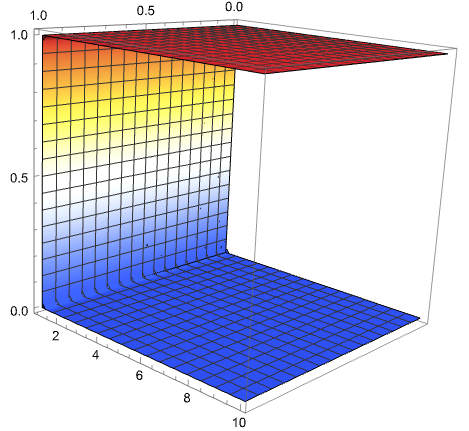
(*step 5*)
RegionPlot3D[! (0 < z < 
     1 && ((1 < y < 1/z && 0 <= x <= 1) || (y > 1/z && 
        0 <= x <= 1))), {x, 0, 1}, {y, 1, 10}, {z, 0, 1}, ColorFunction -> "TemperatureMap",
 PlotPoints -> 50]

enter image description here

$\endgroup$

Your Answer

By clicking “Post Your Answer”, you agree to our terms of service and acknowledge you have read our privacy policy.

Not the answer you're looking for? Browse other questions tagged or ask your own question.