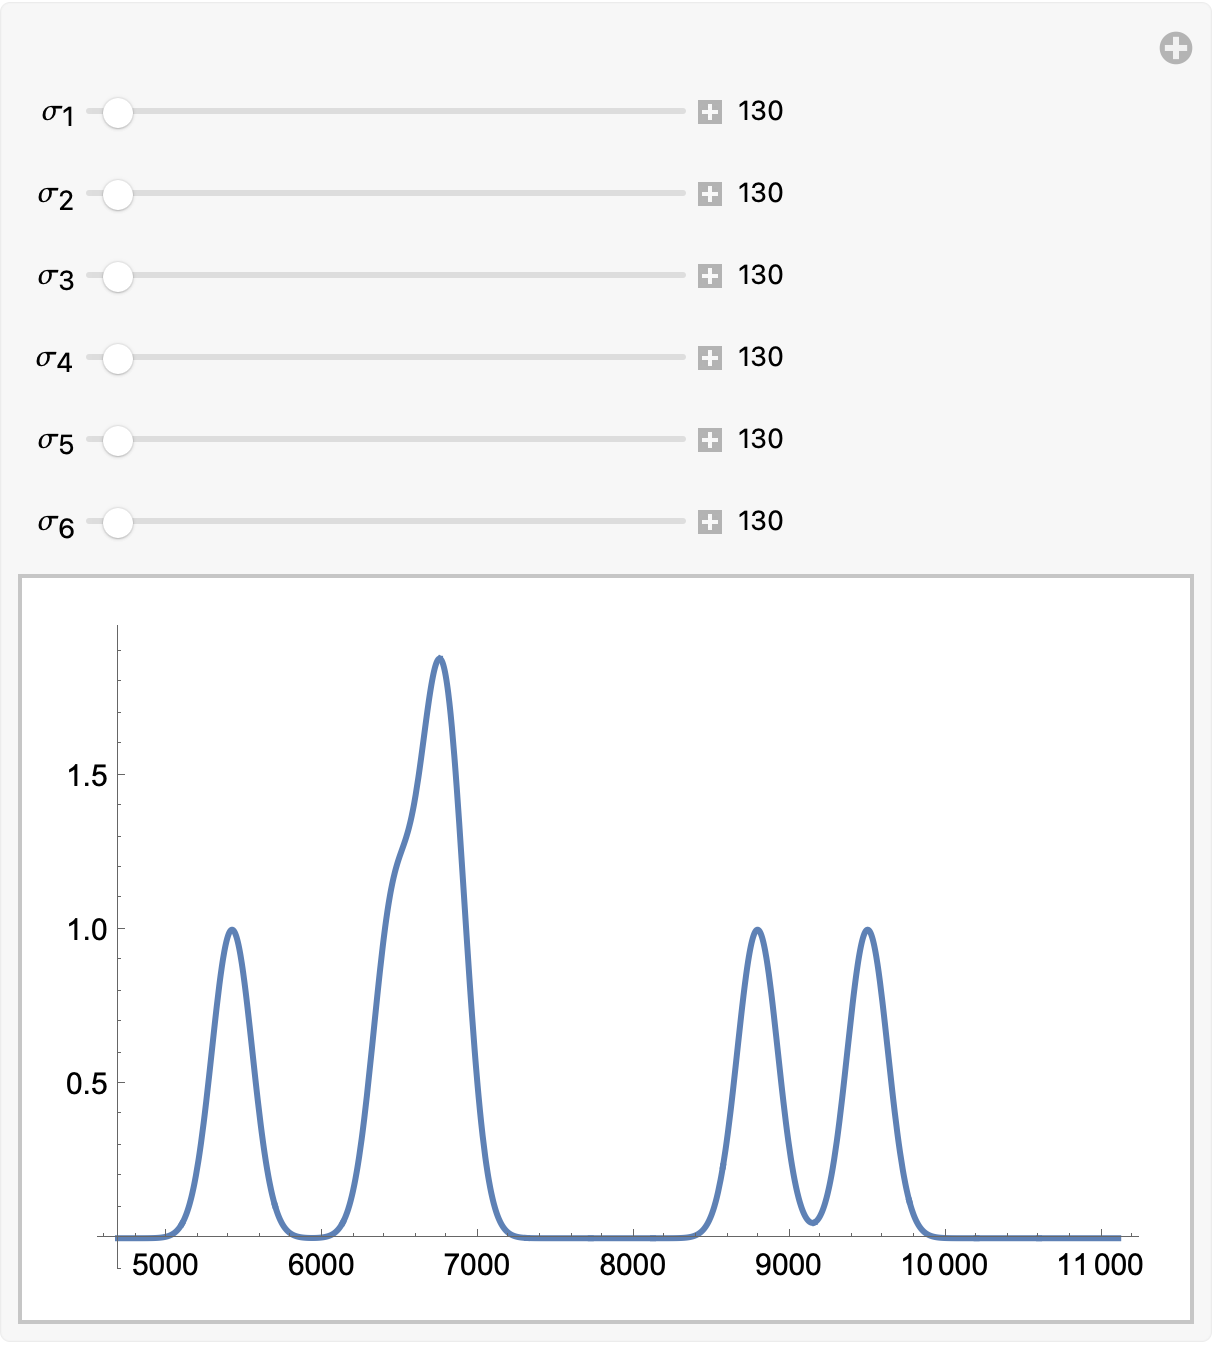
I am trying to create a visual aid for peak fitting. There should be a background profile and on top, I want to place peaks. So far, I am stuck with the following issue. For simplicity, I am using a gaussian and two peaks. I have:
μd = {5422.6501499999995`, 6450.7998`, 6711.8498500000005`,
   6824.2998`, 8795.4004`, 9502.0996`};
{t0, t1} = {4690.5`, 11110.5`};
The following code works as intended (I manipulate the sigmas as I wish):
ClearAll[model0]
model0 = Exp[-((t - μd[[1]])^2/(2 σ1^2))] + Exp[-((t - μd[[2]])^2/(2 σ2^2))];

With[
 {localmodel = model0 /. {σ1 -> σv1, σ2 -> σv2}},
 Manipulate[
  Quiet@Plot[localmodel, {t, t0, t1}, PlotRange -> Full],
  {{σv1, 100}, 0.01, t1 - t0},
  {{σv2, 100}, 0.01, t1 - t0}
 ]
]
Since I am planning to have more peaks in the model, the above will become soon cumbersome and I was hoping to simplify things by defining the model compactly but the approach below is not working (I have never understood how Mathematica interprets subscripts):
model1 = Sum[Exp[-((t - μd[[i]])^2/(2 Subscript[σ, i]^2))], {i, 1, 2}]

With[
 {localmodel = model1 /. {σ -> σv}},
 Manipulate[
  Show[
   Plot[model1[t, σ], {t, t0, t1}, PlotRange -> Full],
  ],
  {{Subscript[σv, 1], 1000}, 0.01, t1 - t0},
  {{Subscript[σv, 2], 1000}, 0.01, t1 - t0}
 ]
]
How should I go about this so that I can define things compactly, ideally also in the Manipulate variables?


Subscript. Use indexed variables instead, likesigma[i]. Also, what exactly does not work in your second attempt? Why are you usingShow[Plot[...]]? It seems theShowwouldn't do anything here. $\endgroup$