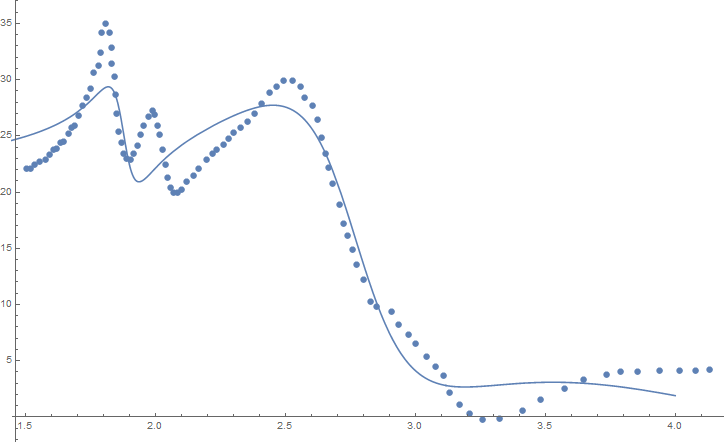
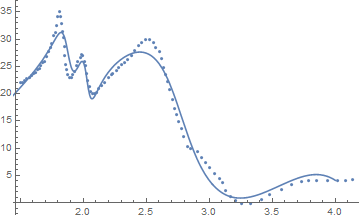
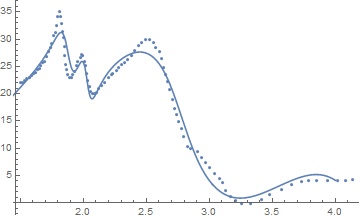
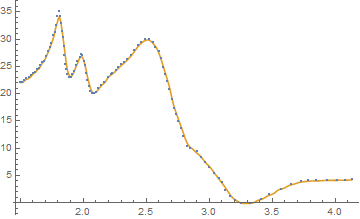
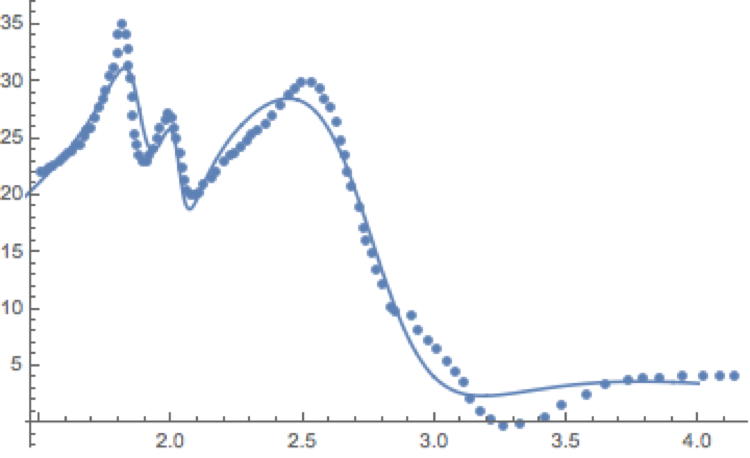
I am trying to fit a set of data with a specific model using the following code. As the figure shows, the fitting procedure is not great. First there is an error message, and as is obvious the fitting curve lacks the required number of peaks. Any suggestions as to how to best fit the data with the given model equation?
dataS = {{1.5040631016957404,
    22.05446614925076}, {1.5214948122848406,
    22.05446614925076}, {1.5377673786834203,
    22.486895879419606}, {1.5535919973280015,
    22.703110744504034}, {1.5771249660714466, 22.919325609588455},
       {1.5920936236176717, 23.351755339757304}, {1.6073491419697115,
    23.784185069926153}, {1.620287200783405,
    23.892292502468365}, {1.6360904891320525,
    24.432829665179423}, {1.6494973106811417, 24.540937097721635},
       {1.66495981834507, 25.189581692974905}, {1.676981103969422,
    25.730118855685962}, {1.689177243413443,
    25.946333720770383}, {1.7063600475229623,
    26.81119318110808}, {1.7219298010236765, 27.67605264144578},
       {1.737786304720355, 28.432804669241257}, {1.7508863658226992,
    29.18955669703674}, {1.762126288255509,
    30.5949533200855}, {1.7818844164451941,
    31.24359791533877}, {1.7913990048481847, 32.4327796733031},
       {1.7956604034971266, 34.16249859397848}, {1.8107362979093506,
    35.02735805431618}, {1.8238614375442779,
    34.16249859397848}, {1.8316060123558566,
    32.865209403471944}, {1.833830843046453, 31.4598127804232},
       {1.842784479227779, 30.270631022458865}, {1.8484250367218138,
    28.64901953432569}, {1.8495572943867873,
    27.02740804619251}, {1.858665538478947,
    25.40579655805933}, {1.8690201396360508, 24.432829665179423},
       {1.8771538278817868, 23.459862772299516}, {1.8900793538510194,
    23.027433042130667}, {1.9043844754728239,
    22.91932560958846}, {1.9164718706122645,
    23.459862772299516}, {1.9311808411251234, 24.108507367552786},
       {1.9448638139104728, 25.081474260432692}, {1.9536725713860417,
    25.946333720770383}, {1.9754011663459174,
    26.703085748565876}, {1.988409955436317,
    27.24362291127693}, {1.9976185247944775, 26.919300613650297},
       {2.008247598975348, 25.946333720770383}, {2.017641260008336,
    25.081474260432692}, {2.0298487330170984,
    23.784185069926153}, {2.0380694470618033,
    22.486895879419606}, {2.0463570182521065, 21.29771412145528},
       {2.0575125305410404, 20.432854661117588}, {2.070208760448426,
    20.000424930948736}, {2.085940778620852,
    20.000424930948736}, {2.1019137305460767,
    20.21663979603316}, {2.1211091182481505, 20.973391823828642},
       {2.1482735570135274, 21.5139289865397}, {2.1652192677575655,
    22.05446614925076}, {2.198323879071299,
    22.91932560958846}, {2.222596642792378,
    23.459862772299516}, {2.2357625855648067, 23.784185069926153},
       {2.262568026172226, 24.216614800095}, {2.283097746582417,
    24.757151962806056}, {2.3022466842110143,
    25.297689125517113}, {2.3270876381088414,
    25.730118855685962}, {2.3543047675106723, 26.27065601839702},
       {2.382166082861296, 27.02740804619251}, {2.4106947283310736,
    27.892267506530203}, {2.439914970220427,
    28.865234399410102}, {2.465818249278822,
    29.405771562121167}, {2.492277432741851, 29.946308724832228},
       {2.529864794115782, 29.946308724832228}, {2.55989253914495,
    29.405771562121167}, {2.5751753139224256,
    28.432804669241257}, {2.604047165517507,
    27.67605264144578}, {2.6244175831132344, 26.486870883481448},
       {2.6404829252930715, 24.86525939534827}, {2.6567461665260383,
    23.459862772299516}, {2.6684859646174215,
    22.16257358179297}, {2.682711406542016,
    20.75717695874422}, {2.70918918918919, 18.919350605526617},
       {2.7263125359799636, 17.18963168485123}, {2.738676622554785,
    16.10855735942911}, {2.7586941268239316,
    14.919375601464775}, {2.776451030803175,
    13.513978978416027}, {2.799620029080939, 12.21668978790948},
       {2.8284682290473735, 10.27075600214967}, {2.849824976799784,
    9.83832627198082}, {2.9074519307569133,
    9.405896541811972}, {2.9357204381207054,
    8.216714783847644}, {2.973301814567886, 7.351855323509947},
       {3.0028718216398964, 6.486995863172255}, {3.045271888519732,
    5.405921537750136}, {3.0794356379551346,
    4.432954644870231}, {3.1079632323585713,
    3.6762026170747464}, {3.130519433275781, 2.162698561483778},
       {3.1699585216345945, 1.0816242360616586}, {3.2104040165031127,
    0.32487220826618085}, {3.2589145824326042, -0.215664954444882}, \
{3.323482156888569, -0.10755752190266817}, {3.4136601387916805,
    0.5410870733506021},
       {3.4805550917279287, 1.5140539662305077}, {3.575346757407733,
    2.4870208591104133}, {3.648796861127818,
    3.351880319448111}, {3.734543366932933,
    3.78431004961696}, {3.7908067754888184, 4.000524914701382},
       {3.853703633481055, 4.000524914701382}, {3.9391724852514995,
    4.108632347243596}, {4.017797352084466,
    4.108632347243596}, {4.077480015018497,
    4.108632347243596}, {4.133296702688033, 4.216739779785803}};


ep = 4.44;
w0 = 0;
w1 = 1.88;
w2 = 2.03;
w3 = 2.78;
w4 = 2.91;
w5 = 4.31;
model = ep +
   10^5*Re[((a0*wp^2)/(w0^2 - \[Omega]^2 - I*\[Omega]*b0))*
       r0 + ((a1*wp^2)/(w1^2 - \[Omega]^2 - I*\[Omega]*b1))*
       r1 + ((a2*wp^2)/(w2^2 - \[Omega]^2 - I*\[Omega]*b2))*
       r2 + ((a3*wp^2)/(w3^2 - \[Omega]^2 - I*\[Omega]*b3))*r3 +
             ((a4*wp^2)/(w4^2 - \[Omega]^2 - I*\[Omega]*b4))*
       r4 + ((a5*wp^2)/(w5^2 - \[Omega]^2 - I*\[Omega]*b5))*r5];
result = NonlinearModelFit[
  dataS, {model, {0.03 > wp > 0.02, 5 > a0 > 0.5, 5 > a1 > 0.5,
    5 > a2 > 0.5, 5 > a3 > 0.5, 5 > a4 > 0.5, 10 > a5 > 0.5,
    5 > b0 > 0, 5 > b1 > 0, 5 > b2 > 0, 5 > b3 > 0, 5 > b4 > 0,
    5 > b5 > 0,
         1 > r0 > 0.1, 1 > r1 > 0.1, 1 > r2 > 0.1, 1 > r3 > 0.1,
    1 > r4 > 0.1, 1 > r5 > 0.1}}, {wp, a0, a1, a2, a3, a4, a5, b0,
   b1, b2, b3, b4, b5, r0, r1, r2, r3, r4, r5}, \[Omega],
  MaxIterations -> 1500, Method -> {NMinimize}]
result["BestFitParameters"]
result["AdjustedRSquared"]
result["AIC"]
fitplot1 =
 Show[ListPlot[dataS], Plot[result[f], {f, 1, 4}, PlotRange -> Full]]

