3
$\begingroup$

I have an input sine wave of:

f=60 Hz.

a[x_]= Sin[(2*\[Pi]*f) * x];

If I want to have an input, the same sine wave but in the frequency domain, how it can be possible?

On paper, I can do it, but try to implement it on Mathematica. I tried Fourier transform but not able to plot the frequency response.

$\endgroup$
2
  • 2
    $\begingroup$ Try: FourierTransform[Sin[(2*\[Pi]*f)*x], x, w] $\endgroup$ Commented Jan 13, 2023 at 9:47
  • 1
    $\begingroup$ @DanielHuber Thanks! as, I mentioned in the question the Fourier transform works but I am not able to plot the frequency response in Mathematica of input sine wave. $\endgroup$
    – a019
    Commented Jan 13, 2023 at 9:56

1 Answer 1

6
$\begingroup$

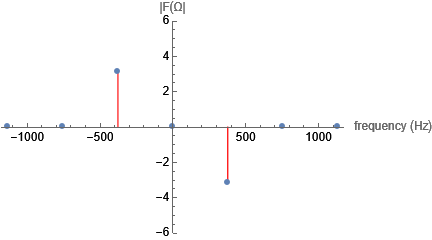
I am not able to plot the frequency response in Mathematica

Do you mean like this?

Clear["Global`*"];
f = 60;
fInRadians = 2*π*f;
signal = Sin[fInRadians*t];
y = FourierTransform[signal, t, w, FourierParameters -> {1, -1}];
tab = Table[{k, y /. w -> k}, {k, -3 fInRadians, 3 fInRadians, fInRadians}]
tab = tab /. DiracDelta[0] -> 1
tab[[All, 2]] = Map[Sign[Im[#]] Abs[#] &, tab[[All, 2]]];
ListPlot[tab, PlotStyle -> AbsolutePointSize[5], 
 AxesLabel -> {"frequency (Hz)", "|F(Ω|"}, 
 PlotRange -> {All, {-6, 6}}, Filling -> Axis, FillingStyle -> Red]

Mathematica graphics

$\endgroup$

Your Answer

By clicking “Post Your Answer”, you agree to our terms of service and acknowledge you have read our privacy policy.

Not the answer you're looking for? Browse other questions tagged or ask your own question.