1
$\begingroup$

For example we have a sinusoidal function and we want to find frequency of this function/ For those we use Discrete Fourier Transform. Code:

fB = 1.0;
Data1 = Table[Sin[2 Pi fB x], {x, 0, 5, 1/10}];
sra = 10./1;
inco = sra/Length[Data1];
fresa = Table[f, {f, 0, sra - inco, inco}];
ListPlot[Transpose[{fresa, Flatten[Abs[Fourier[Data1]]]}], 
 PlotRange -> {Full, Full}, Joined -> True, Frame -> True, 
 FrameLabel -> {Row[{Style["Frequency", FontSlant -> Italic, 
      FontSize -> 15]}], 
   Row[{Style["Amplitude", FontSlant -> Italic, FontSize -> 15]}]}, 
 LabelStyle -> Blue
 , FrameTicksStyle -> Directive[Orange, 15], ImageSize -> 900, 
 PlotStyle -> {Red}, Joined -> True, AspectRatio -> 0.5, 
 Epilog -> {PointSize[0.003], 
   Point[Transpose[{fresa, Flatten[Abs[Fourier[Data1]]]}]]}]

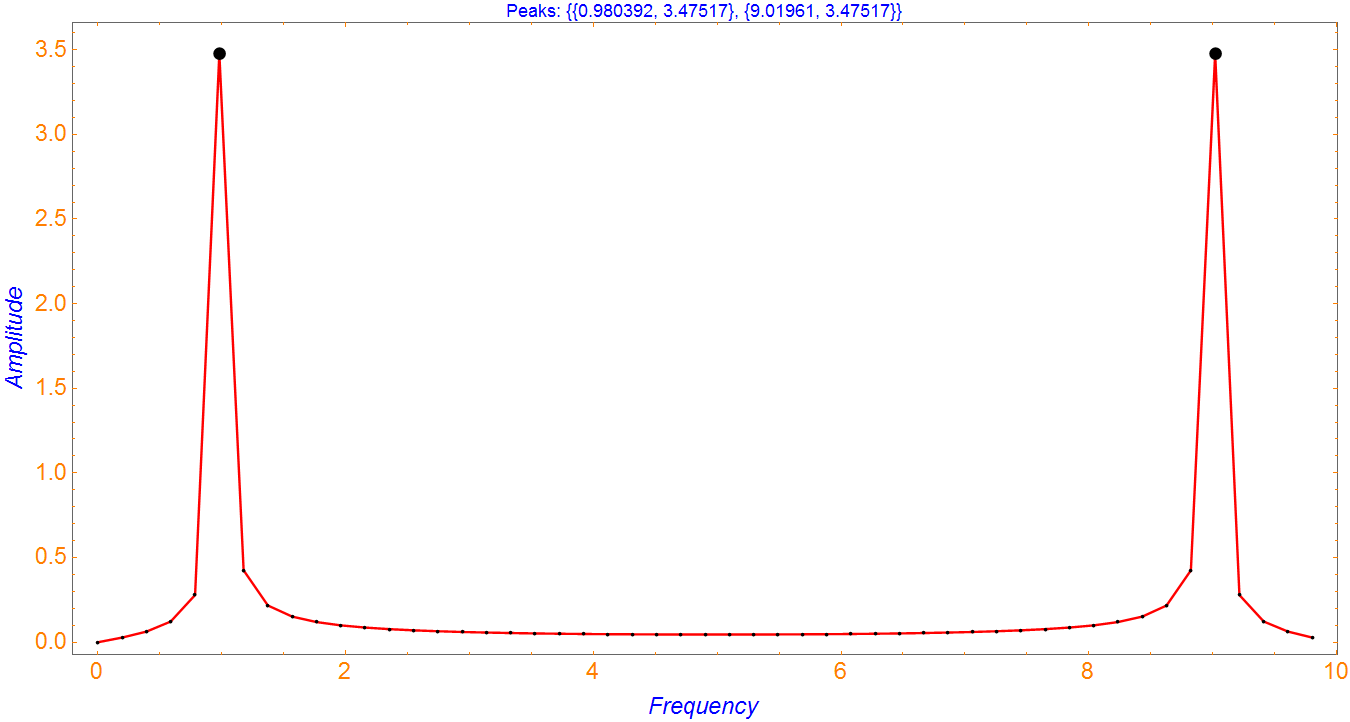
From Fourier spectrum we can see that value of ours frequency is 1. Question is about How we can find frequency automatically, i want to see value, not finding it by "Get Cordinates" Fourier spectrum
To @andre mistakes

$\endgroup$
10
  • 1
    $\begingroup$ You can use FindPeaks on the transformed data, so long as the data is in Reals. $\endgroup$ Commented Mar 11, 2017 at 19:18
  • 1
    $\begingroup$ spectralData=Transpose[{fresa, Flatten[Abs[Fourier[Data1]]]}]; MaximalBy[Take[spectralData,Round[Length[spectralData]/2]],#[[2]]&,1] $\endgroup$
    – andre314
    Commented Mar 11, 2017 at 20:18
  • 1
    $\begingroup$ Related $\endgroup$
    – andre314
    Commented Mar 11, 2017 at 20:19
  • $\begingroup$ @andre, i have massage about mistakes $\endgroup$
    – John
    Commented Mar 11, 2017 at 20:33
  • $\begingroup$ It works by me. Have you evaluated fresa first ? $\endgroup$
    – andre314
    Commented Mar 11, 2017 at 20:42

1 Answer 1

1
$\begingroup$

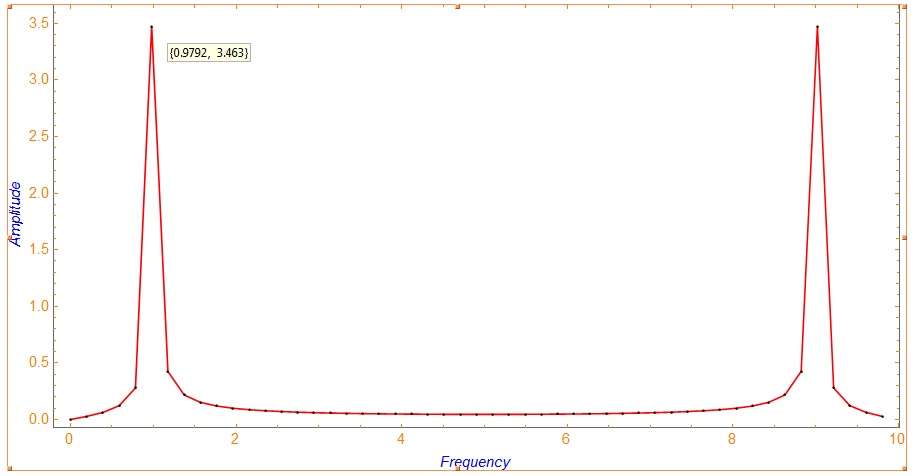
By calculating the frequency data first, you can use FindPeaks to obtain the peak positions and values:

fB=1.0;
Data1=Table[Sin[2 Pi fB x],{x,0,5,1/10}];
sra=10./1;
inco=sra/Length[Data1];
fresa=Table[f,{f,0,sra-inco,inco}];
fData=Transpose[{fresa,Flatten[Abs[Fourier[Data1]]]}];
peaks=fData[[FindPeaks[fData[[All,2]]][[All,1]]]];
ListPlot[fData,PlotRange->{Full,Full},Joined->True,Frame->True,FrameLabel->{Row[{Style["Frequency",FontSlant->Italic,FontSize->15]}],Row[{Style["Amplitude",FontSlant->Italic,FontSize->15]}]},LabelStyle->Blue,FrameTicksStyle->Directive[Orange,15],ImageSize->900,PlotStyle->{Red},Joined->True,AspectRatio->0.5,Epilog->{PointSize[0.003],Point[fData],Black,PointSize[.01],Point[peaks]},PlotLabel->"Peaks: "<>ToString[peaks]]

enter image description here

$\endgroup$

Your Answer

By clicking “Post Your Answer”, you agree to our terms of service and acknowledge you have read our privacy policy.

Not the answer you're looking for? Browse other questions tagged or ask your own question.