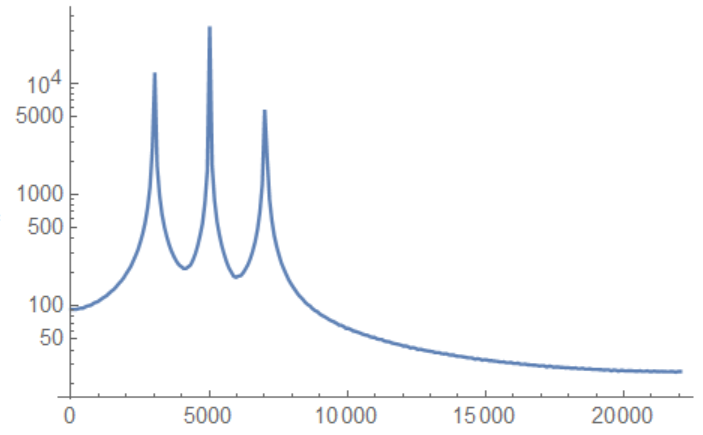
Assuming we have three sine waves:
audio = Audio[Array[0.2*Sin[2 \[Pi] 3000 #] + 0.5*Sin[2 \[Pi] 5000 #] + 0.1 Sin[2 \[Pi] 7000 #] &, 44100, {0, 1}]]
Spectrogram@audio
View the Spectrogram you can verify it really have three sine waves.
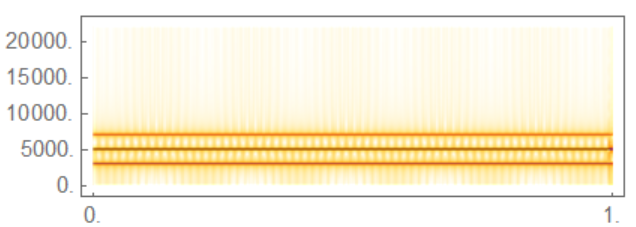
SpectrogramArray[audio] do the same thing,the row is represent time,the column is represent frequency.
ListLogPlot[#[[;; Round[Length@#/2]]] &@Total@Abs@SpectrogramArray[audio], PlotRange -> All, Joined -> True,DataRange -> {0,QuantityMagnitude[AudioSampleRate@audio/2]}]
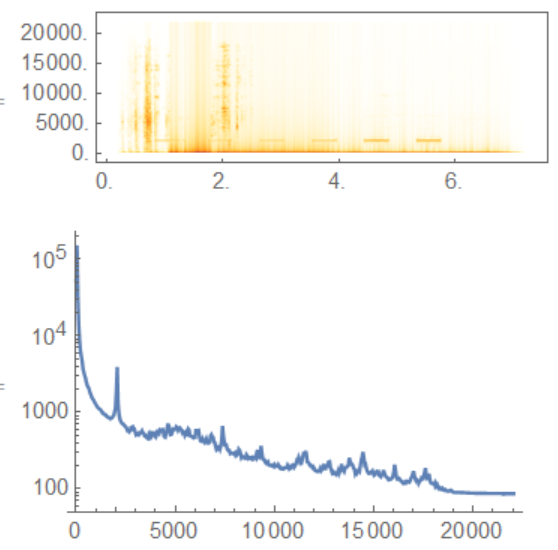
if you use *.mp3 file:
audio = Import["ExampleData/car.mp3"];
Spectrogram@audio
ListLogPlot[#[[;; Round[Length@#/2]]] &@Total@Abs@SpectrogramArray[audio], PlotRange -> All, Joined -> True, DataRange -> {0,QuantityMagnitude[AudioSampleRate@audio/2]}]
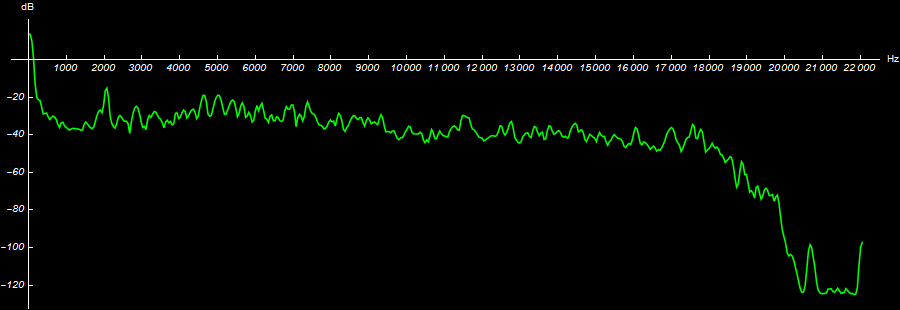
Also do fourier analysis in all audio data.
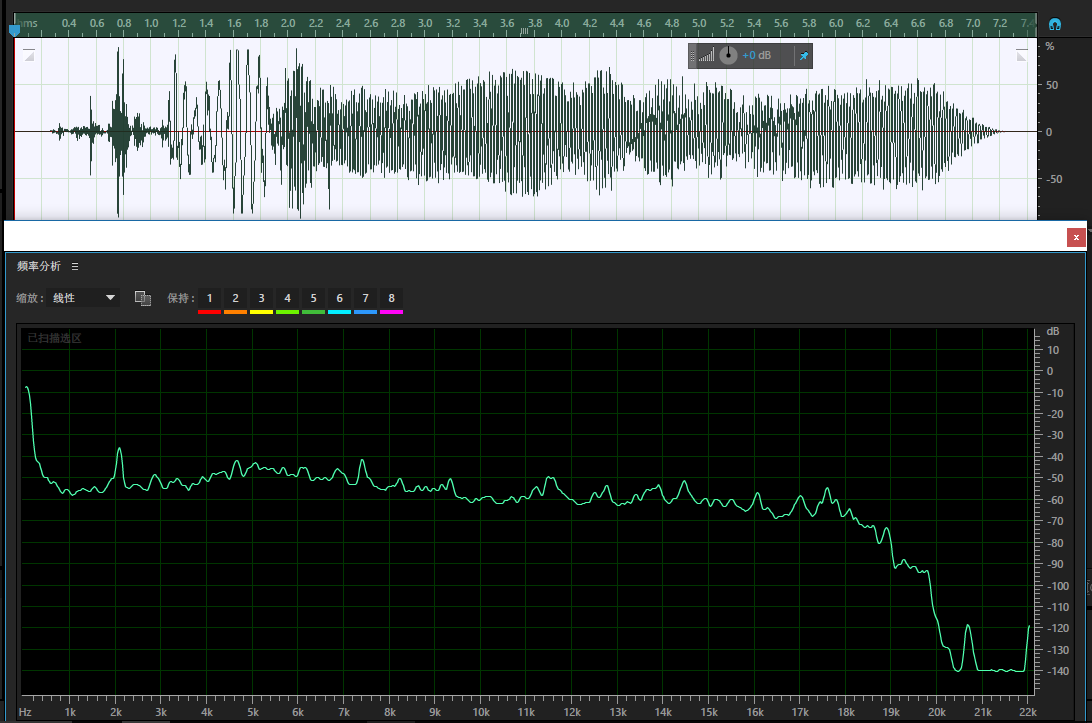
Periodogram[Flatten@AudioData[audio], 1024, 1024, BlackmanHarrisWindow,
            SampleRate -> QuantityMagnitude@AudioSampleRate[audio],
            Ticks -> {Range[0, 22000, 1000], Range[0, -160, -20]},
            TicksStyle -> Italic, AspectRatio -> 1/3,
            AxesLabel -> {"Hz", "dB"}, ImageSize -> 900,
            Background -> Black, PlotStyle -> Green,
            AxesStyle -> White, PlotRange -> All]
