2
$\begingroup$

I want to make an animated BarChart. In this I want to plot different tables which range from $10^{-60}$ to $1$.

For example:

{0.1,0.2,10^-3,10^-16,0.01,10^-20}

and the next data set goes to:

{0.11,0.19,10^-2,10^-12,0.0001,10^-10}

However, I can't set the BarChart with ScalingFunctions->"Log" to only start if a number for the chart is higher than $10^{-12}$. Does anyone know a way to fix this?

P.S.: I already tried PlotRange->{10^-12,1}. Doesn't work though.

$\endgroup$

1 Answer 1

3
$\begingroup$

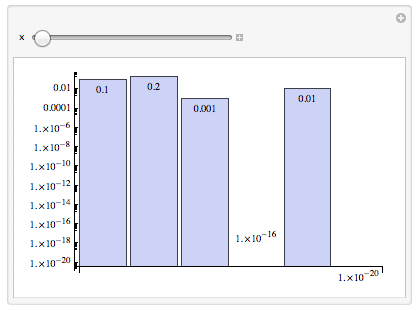
I'm not too sure what you mean, but you seem to want to not draw the bars if they're too short. So - just an idea - you could try drawing the bars yourself:

cef[{{xmin_, xmax_}, {ymin_, ymax_}}, y_, ___] :=
  If[y > 10^-12,
    Rectangle[{xmin, ymin}, {xmax, ymax}],
    Rectangle[{xmin, ymin}, {xmin, ymin}] (* zero height *)]

Manipulate[
  BarChart[data[[x]],
   ChartLabels -> Placed[N@data[[x]], Top], 
   ScalingFunctions -> "Log",
   ChartElementFunction -> cef], 
 {x, 1, 2, 1}]

barchart

Because the < 10^-12 bars are drawn with zero height (for testing), they show up as labels but can't be seen.

With a better idea of what your current code is like, more might be possible...

$\endgroup$

Your Answer

By clicking “Post Your Answer”, you agree to our terms of service and acknowledge you have read our privacy policy.

Not the answer you're looking for? Browse other questions tagged or ask your own question.