Is there any way to make Mathematica visualize a multistate square lattice? That is, I have a data set from a simulation that is x coloumns wide and y rows tall (just a simple .dat file), where each cell has a value *n_i = 0,1,2,3* - and I then want Mathematica to draw a x by y square lattice and color each square in the lattice corresponding to the state in the data set, e.g. 0 = red, 1 = green, 2 = blue, 3 = yellow.
2 Answers
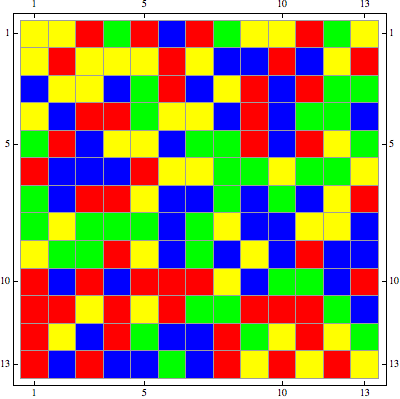
You can use ArrayPlot or MatrixPlot. Note that Mesh setting is optional. It works well if squares are large, but should not be used for small square sizes. MatrixPlot is very intelligent for large arrays of data - it deduces best approximate visual form: "sufficiently large or sparse matrices are downsampled so that their structure is visible in the plot" ~ Documentation.
Make some data and save in .DAT file:
dat = RandomInteger[{0, 3}, {13, 13}];
Export["test.dat", dat];
Now import that file and plot:
imp = Import["test.dat"];
MatrixPlot[imp, ColorRules -> {0 -> Red, 1 -> Green, 2 -> Blue, 3 -> Yellow},Mesh -> True]

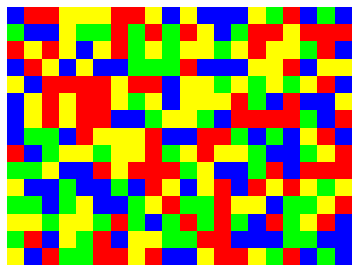
ArrayPlot[]/MatrixPlot[] are the most straightforward ways to go about this. Alternatively, one could use Raster[] or Image[] for the purpose:
BlockRandom[SeedRandom[42, Method -> "MersenneTwister"]; (* for reproducibility *)
            arr = RandomInteger[{0, 3}, {15, 20}]];

colorRules = Thread[Range[0, 3] -> List @@@ {Red, Green, Blue, Yellow}];
From here, we could do either of
Image[arr /. colorRules, ImageSize -> 300]
or
Graphics[Raster[Reverse[arr] /. colorRules]]
to give this:

-
$\begingroup$ Thank you - in this particular case, I happen to like that there is a grid included, but I've noted yours too for when I need to make a completely clean/code-color only representation. Which I happen to also need. $\endgroup$– NielsenCommented May 30, 2013 at 9:02
-
2$\begingroup$ @nielsen to remove the grid in the other solution, just use
Mesh->False- that's what the second sentence of that answer is all about. $\endgroup$– C. E. ♦Commented May 30, 2013 at 15:20
