12
$\begingroup$

I started building this Manipulate and am certain I can do so on my own, but thought it was fun enough that others might want to try. (If this is some abuse of the SE, I'm happy to take this question down.) Nevertheless....


The TV game show Deal or No Deal involves 26 closed briefcases, each containing a card indicating a different dollar amount (randomly chosen from the list below and assignments known to nobody). The player randomly chooses one case, which becomes "hers" and remains closed throughout the game and is "out of play." (Of course she hopes it holds \$1,000,000.)

The player then selects other available cases which are then opened, one-by-one, revealing their value. It is entirely a matter of chance but the player hopes that the cases she chooses bear small dollar values, thereby increasing the evidence that hers bears a high value.

After specified numbers of cases have been opened, the "banker" offers to buy the player's case from her; if the player accepts the deal, the game is over. His offer is based on the expected value of the unopened briefcases. If many of the low-value cases have been opened (and removed), then the banker's offer will be high. If instead many of the high-value cases have been opened (and removed), then the banker's offer will be low. Upon giving this offer, the host asks the player: "Deal, or No Deal?"

Most of the time the player rejects the deal and must open more cases. (It is quite obvious that the early bank offers are very low, thereby encouraging the player to continue... making dramatic television.) Such play continues until the player finds an offer so attractive she takes it, thereby ending the game.

I'd like to build a Manipulate for playing along with the game. It should show TogglerBars with the 26 dollar amounts. We click on the values of the cases opened. (I started the TogglerBar, with $26$ cash values, below.)

I'd like a Manipulate to "play along," or at least present the game in a statistically helpful way. As such:

  • The TogglerBars should lie to the left of the central window, in the column form in this started code, below. The observer will click on the corresponding cell whenever a briefcase is opened.
  • The main panel in the Manipulate should be BoxWhiskerChart, with 26 ticks along the horizontal axis, corresponding to the opening of each successive briefcase. The plot should show the classic BarWhisker representation of the dollar amounts still in play (closed briefcases).
  • A red line should connect the means as the play proceeds, tracking the expected value in the closed suitcases... marching to the right during the game.
  • The title or other label of the graph should state the current average value of the closed briefcases. (This is the current expected winning of the player.)
  • After the 6th, 11th, 15th, 18th, 20th, 21st, ... 25th the banker gives his offer. The Manipulate should have a text window in which we can type in the banker's current offer. I'd like a blue line connecting these bank offers on the BarWhiskerPlot to thus reveal when an offer is attractive or not.
  • Extra credit for the statistically savvy: Include a red/green indicator light to tell the player whether she "should" accept the banker's offer.

Here's a start that gets the controls on the left.

Manipulate[
 
 full = {0.01, 1, 5, 10, 25, 50, 75, 100, 200, 300, 400, 500, 750, 
   1000, 5000, 10000, 25000, 50000, 75000, 100000, 200000, 300000, 
   400000, 500000, 750000, 1000000};
 lst = Complement[full, Union[x1, x2]];
 
 BoxWhiskerChart[{full, {100, 200, 300, 400, 500, 750, 200000, 
    1000000}, {100000, 200000, 300000, 400000, 500000, 
    750000}, {}, {}, {}, {}, {}, {}, {}, {}, {}, {}, {}, {}, {}, {}, \
{}, {}, {}, {}, {}, {}, {}, {}, {}},
  PlotLabel -> 
   Text[Style["Expected win $" <> ToString[Round[Mean[lst]]]]],
  ChartLabels -> Range[26]],
 
 Row[{
   TogglerBar[
    Dynamic[x1], {0.01, 1, 5, 10, 25, 50, 75, 100, 200, 300, 400, 500,
      750}, Appearance -> "Vertical"], 
   TogglerBar[
    Dynamic[x2], {1000, 5000, 10000, 25000, 50000, 75000, 100000, 
     200000, 300000, 400000, 500000, 750000, 1000000}, 
    Appearance -> "Vertical"]}], ControlPlacement -> Left,
 FrameLabel -> Style["DEAL OR NO DEAL", Blue, Large]]

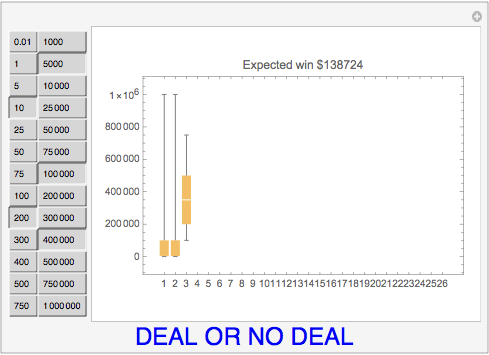
Next will come the BoxWhisker graphs based on the number of suitcases still closed and their values.

Deal or no deal

Still work to be done!

$\endgroup$

2 Answers 2

2
$\begingroup$

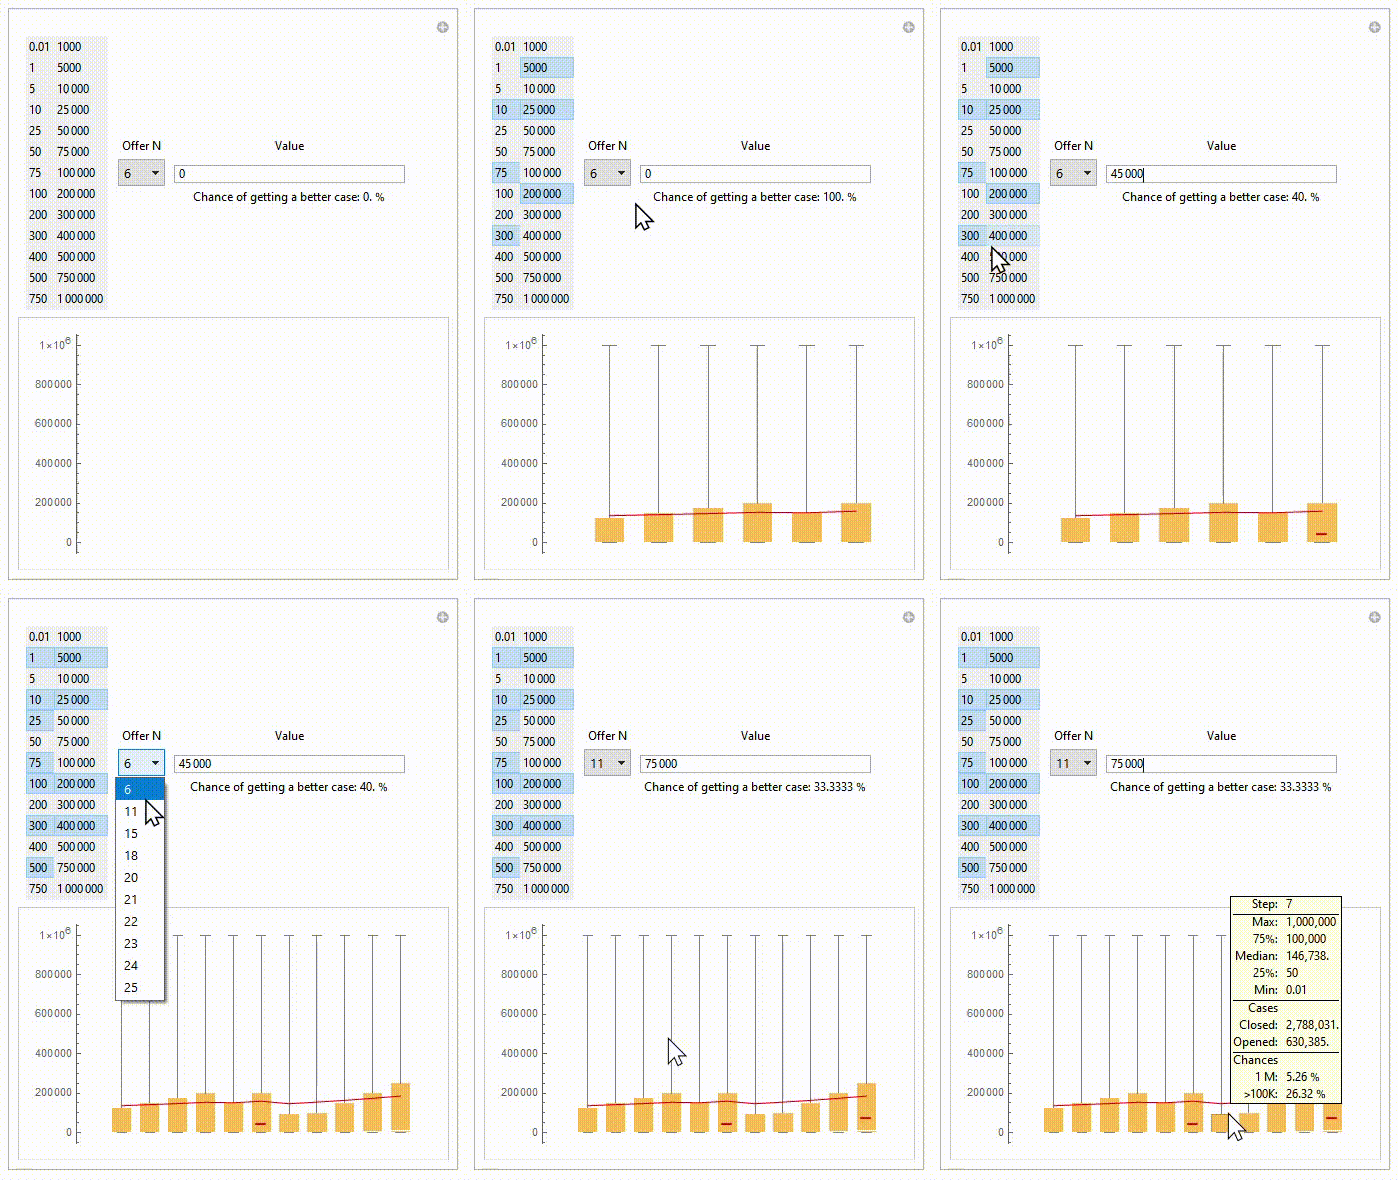
This answer is not as beautiful as kglr's solution, my main focus is functionality. You can tell an offer is good or not, base on the number that appears below the input form (chance of opening a better case). (after you enter the offer click somewhere. if you press enter, the result will be duplicated)

enter image description here

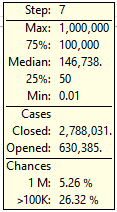
If you hover on each step, all the necessary information at that step appears, including:

  • Step + (offer)
  • Statistics of closed cases
  • Total amount of closed and opened cases
  • Chance of winning 1M and over 100K

enter image description here

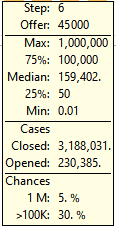
If that step has an offer, the label will show that too:

enter image description here

openedCases = {};

(* defined data *)
prices = {0.01, 1, 5, 10, 25, 50, 75, 100, 200, 300, 400, 500, 750, 
   1000, 5000, 10000, 25000, 50000, 75000, 100000, 200000, 300000, 
   400000, 500000, 750000, 1000000};
offerPos = {6, 11, 15, 18, 20, 21, 22, 23, 24, 25};
offers = ConstantArray[0, Length@prices];

(* function to calculate chance of con function over data *)
chance[data_, con_] := 
 ToString@Round[100*Count[data, c_ /; con@c]/Length@data, .01] <> " %"

(* function to generate BoxWhisker labels *)
label[data_, index_, label_] := Module[{hasOffer, divideLineIndicies},
  
  hasOffer = MemberQ[offerPos, index[[2]]];
  divideLineIndicies = {{2}, {7}, {10}};
  If[hasOffer, divideLineIndicies += 1];
  
  Grid[{{"Step:", Last@index}, 
     If[hasOffer, {"Offer:", Dynamic@offers[[index[[2]]]]}, 
      Nothing], {"Max:", Max[data]}, {"75%:", 
      Quantile[data, 3/4]}, {"Median:", N@Mean[data]}, {"25%:", 
      Quantile[data, 1/4]}, {"Min:", 
      Min[data]}, {"Cases"}, {"Closed:", 
      AccountingForm@Total[data]}, {"Opened:", 
      Total@prices - Total@data}, {"Chances"}, {"1 M:", 
      chance[data, # == 10^6 &]}, {">100K:", 
      chance[data, # >= 10^5 &]}}, Alignment -> {{Right, Left}}, 
    Dividers -> {{False}, 
      ReplacePart[ConstantArray[False, 13], 
       divideLineIndicies -> True]}] /. 
   n_Real | n_Integer /; n > 1000 :> 
    NumberForm[n, DigitBlock -> 3, 
     ScientificNotationThreshold -> {-7, 7}]]

Manipulate[
 notOpened = 
  MapIndexed[Complement[prices, openedCases[[;; #2[[1]]]]] &, 
   openedCases];
 If[Length@openedCases >= offerN, 
  temp = Complement[prices, openedCases[[;; offerN]]], temp = {0}];
 
 Show[
  BoxWhiskerChart[notOpened, 
   LabelingFunction -> (Placed[label[##], Tooltip] &)], 
  ListLinePlot[Mean /@ notOpened, PlotStyle -> Red], 
  ListPlot[offers[[;; Length@openedCases]] /. {0 -> Indeterminate}, 
   PlotStyle -> Red, PlotMarkers -> {"-", Large}], 
  Frame -> {{True, False}, {False, False}}, 
  PlotRange -> {Automatic, {0, Max@prices}}],
 
 
 Row@{
   TogglerBar[Dynamic[openedCases], prices, 
    Appearance -> "Vertical" -> {Automatic, 2}],
   , Spacer[5],
   Grid@{
     {"Offer N", "Value"},
     {PopupMenu[Dynamic@offerN, offerPos], 
      InputField[Dynamic@offers[[offerN]], Number]},
     {"", 
      Row[{"Chance of getting a better case: ", 
        N@Dynamic[
          Count[temp, p_ /; p > offers[[offerN]]]*100/Length@temp], 
        " %"}]}}}]
$\endgroup$
2
  • $\begingroup$ Oh very nice.... indeed, it is the functionality I seek. (+1). Let me wait just a bit before a final accept. Thanks! $\endgroup$ Commented Mar 12, 2021 at 21:53
  • $\begingroup$ I just played along with the TV show... and your Manipulate was great. There are a few teeny changes (Mean instead of Median), but full accept. Thanks for your efforts! ($\checkmark$) $\endgroup$ Commented Mar 13, 2021 at 4:42
7
$\begingroup$

We need a custom control because TogglerBar does not quite do the job as it shows the value that is being clicked and it allows opened briefcases to be closed again with the next click. With the function togglerGrid below (1) we cannot see the contents of the briefcase until it is opened, and (2) once a briefcase is opened it remains open.

ClearAll[togglerGrid]
togglerGrid[Dynamic[y_], vals_, dims_, size_: {20, 20}, col_: LightGray] := 
 Deploy @ Grid[ArrayReshape[
    Table[With[{i = i}, 
      Item[Setter[Dynamic[MemberQ[y, i], If[! MemberQ[y, i], AppendTo[y, i]] &], 
        {True}, i, Appearance -> None, Alignment -> Center, ImageSize -> size], 
       ItemSize -> {All, 1}, Frame -> White, FrameStyle -> Thick,
       BaseStyle -> Dynamic[If[MemberQ[y, i], Black, col]], 
       Background -> Dynamic[If[MemberQ[y, i], Lighter@Lighter@col, col]]]], {i, 
      vals}], dims, ""], Spacings -> {.1, .1}, 
   Dividers -> All, FrameStyle -> White, Alignment -> {Center, Center}, 
   ItemStyle -> FontSize -> 16]

A few non-functional elements for embellishments:

logo = Row[{Text[Framed[Style[" DEAL ", FontFamily -> "Stencil", FontSize -> 73, 
       FontColor -> Black, FontWeight -> "Plain"], Background -> Red]],
    Framed[Style[" NODEAL ", FontFamily -> "Stencil", FontSize -> 73, 
      FontColor -> Red, FontWeight -> "Plain"], Background -> Black]}];

briefcase = Graphics[{Rectangle[{0, 0}, {3, 2}, "RoundingRadius" -> .15], 
    Annulus[{3/2, 3/2}, {7/10, 8/10}], 
    White, Disk[{1, 2/3}, {.1, .15}], Disk[{2, 2/3}, {.1, .15}], 
    Thick, Line[{{0, 2/3}, {3, 2/3}}]}];


values = {0.01, 1, 5, 10, 25, 50, 75, 100, 200, 300, 400, 500, 750, 
   1000, 5000, 10000, 25000, 50000, 75000, 100000, 200000, 300000, 
   400000, 500000, 750000, 1000000};

... and a Manipulate:

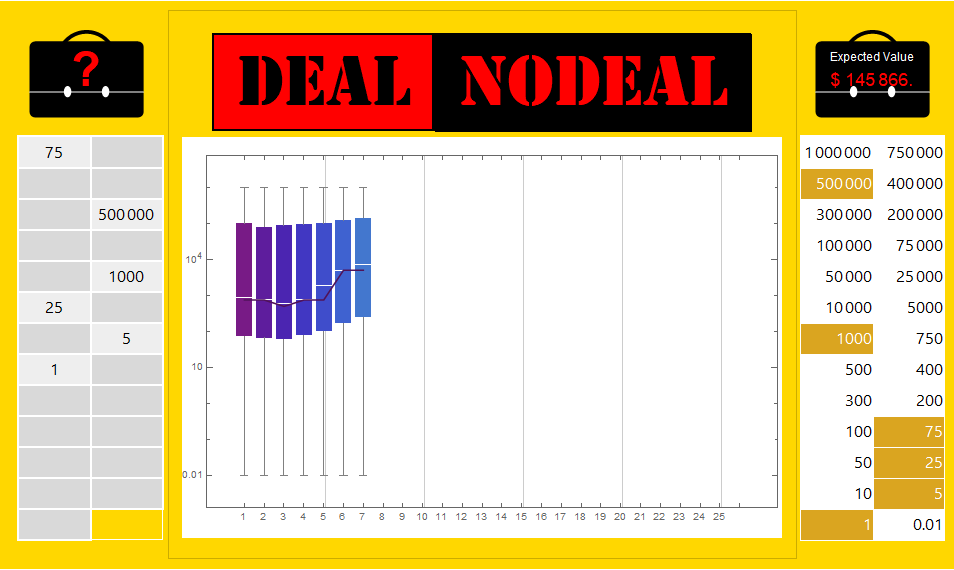
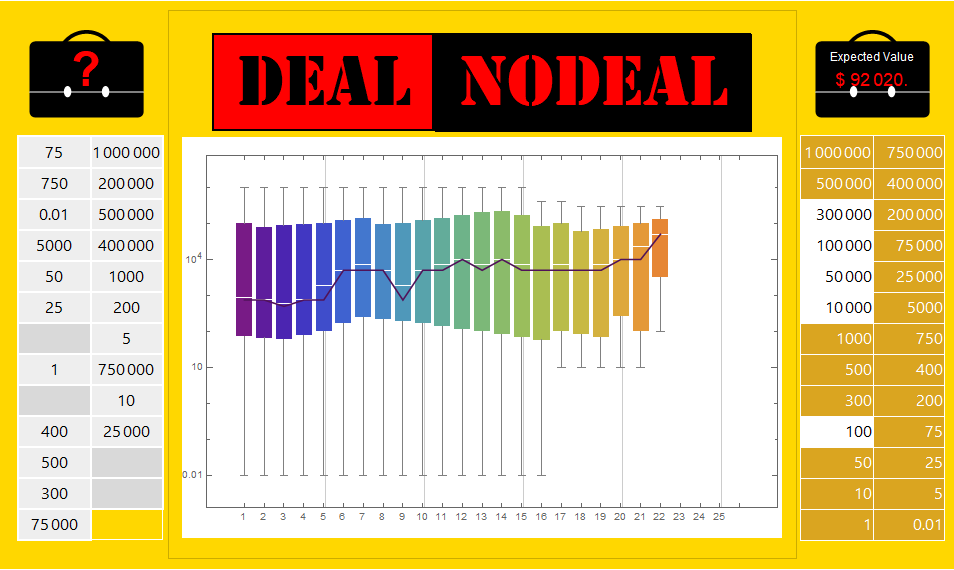
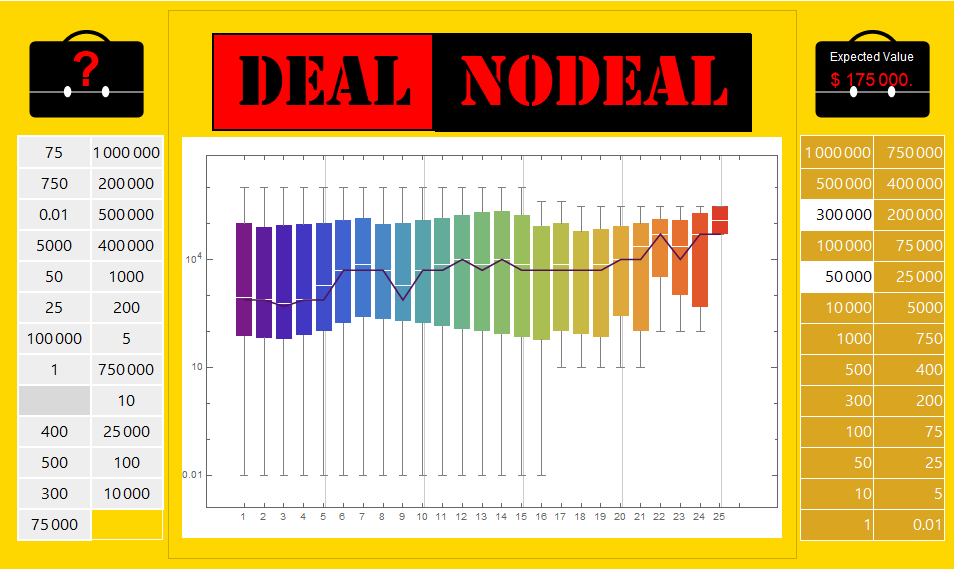
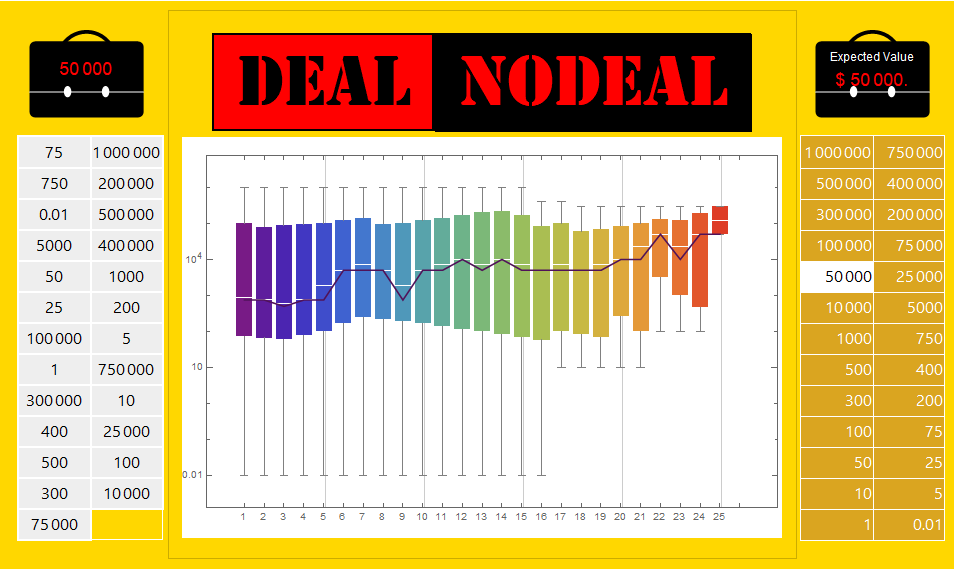
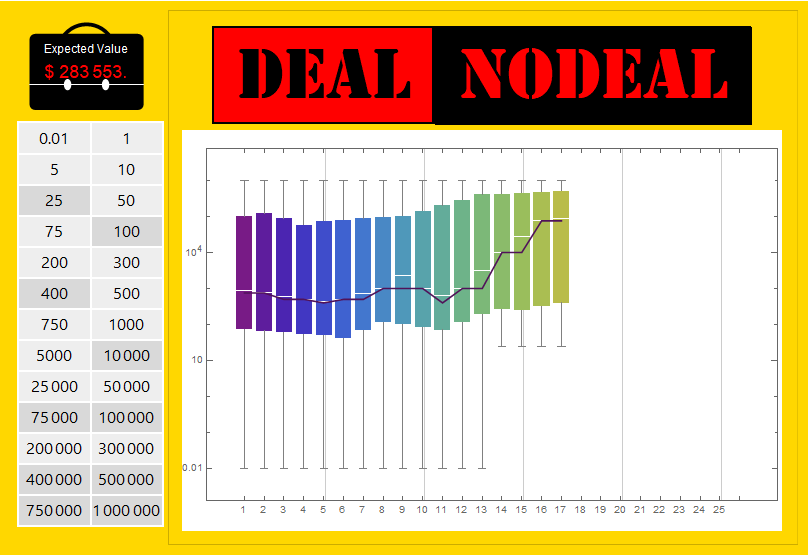
We shuffle values as initialization and assume the first briefcase is the one taken by the player. We update the data sets fed into BoxWhiskerChart as the remaining briefcases are opened. The top-right briefcase shows the expected value of currently closed briefcases. We use log-scaling in BoxWhiskerChart because with linear scaling the charts look too squeezed at the bottom.

Style[#, DefaultOptions -> {Panel -> {Background -> ColorData["HTML", "Gold"]}}] & @
 Manipulate[Labeled[
    BoxWhiskerChart[PadRight[Complement[rs, Take[a, #]] & /@ Range[0, Length@a], 
       Length @ values, {{}}], ScalingFunctions -> "Log", 
     Background -> White, ImageSize -> {600, 400}, Joined -> True, 
     ChartLabels -> Placed[Range[25], Axis], ChartStyle -> "Rainbow", 
     GridLines -> {{5, 10, 15, 20, 25}, None}], logo, Top], 
   Column[{Dynamic @ Panel @ Magnify[Show[briefcase, 
        Epilog -> Text[If[Length@Complement[rs, a] == 1, 
           Style[First @ rs , Red, FontSize -> Scaled[.15]], 
           Style["?" , Red, Bold, FontSize -> Scaled[.4]]], {3/2, 5/4}]], 1/3], 
    Control @ {{a, {}, ""}, rs, togglerGrid[#, Rest@rs, {13, 2}, {70, 30}] &}, 
     Control@{{rs, RandomSample[values]}, None}}, Alignment -> Center],
    Column[{Dynamic @ Panel @ Magnify[
       Show[briefcase, Epilog -> Text[Style[
           Column[{Style["Expected Value", White, FontSize -> Scaled[.1]], 
             Row[{"$ ", N @ Mean[Complement[rs, a]]}]}, 
            Alignment -> Center], Red, FontSize -> Scaled[.15]], {3/2, 5/4}]], 1/3], 
       Grid[Partition[Map[Item[Pane[Dynamic @ Style[#, 16,
            If[MemberQ[a, #], White, Black]], 
          ImageSize -> {70, 30}, Alignment -> {Right, Center}], 
         Background -> Dynamic @ If[MemberQ[a, #], ColorData["HTML", "Goldenrod"], 
            White]] &, Reverse @ values], 2],
     Spacings -> {.1, .1}, Dividers -> All, FrameStyle -> White]},
    Alignment -> Center], 
  ControlPlacement -> {Left, Right}, 
  Method -> {"ContentAreaBackground" -> ColorData["HTML", "Gold"]}, 
  AppearanceElements -> {}]

Screenshots:

enter image description here

enter image description here

enter image description here

enter image description here

Update: To get a play-along version, remove BaseStyle -> ... from togglerGrid and RandomSample from the second control. Since right panel is now redundant we can remove it too.

ClearAll[togglerGrid2]
togglerGrid2[Dynamic[y_], vals_, dims_, size_: {20, 20}, col_: LightGray] := 
 Deploy @ Grid[ArrayReshape[Table[With[{i = i}, 
    Item[Setter[Dynamic[MemberQ[y, i], If[! MemberQ[y, i], AppendTo[y, i]] &], 
          {True}, i, Appearance -> None, Alignment -> Center, ImageSize -> size], 
       ItemSize -> {All, 1}, Frame -> White, FrameStyle -> Thick,
       Background -> Dynamic[If[MemberQ[y, i], Lighter@Lighter@col, col]]]], 
      {i,  vals}], dims, ""],
   Spacings -> {.1, .1}, Dividers -> All, 
   FrameStyle -> White, Alignment -> {Center, Center}, 
   ItemStyle -> FontSize -> 16]

Style[#, DefaultOptions -> {Panel -> {FrameStyle -> None, 
       Appearance -> "Frameless", Background -> ColorData["HTML", "Gold"]}}] &@
 Manipulate[Labeled[BoxWhiskerChart[
    PadRight[Complement[rs, Take[a, #]] & /@ Range[0, Length@a], 
     Length@values, {{}}], ScalingFunctions -> "Log", 
    Background -> White, ImageSize -> {600, 400}, Joined -> True, 
    ChartLabels -> Placed[Range[25], Axis], ChartStyle -> "Rainbow", 
    GridLines -> {{5, 10, 15, 20, 25}, None}], logo, Top], 
  Column[{Dynamic @ Panel @ Magnify[Show[briefcase, 
        Epilog -> Text[Style[Column[{Style["Expected Value", White, 
              FontSize -> Scaled[.1]], 
             Row[{"$ ", N@Mean[Complement[rs, a]]}]}, Alignment -> Center], 
          Red, FontSize -> Scaled[.15]], {3/2, 5/4}]], 1/3], 
    Control@{{a, {}, ""}, rs, togglerGrid2[#, rs, {13, 2}, {70, 30}] &}, 
    Control@{{rs, values}, None}}, Alignment -> Center], 
  ControlPlacement -> {Left, Right}, 
  Method -> {"ContentAreaBackground" -> ColorData["HTML", "Gold"]}, 
  AppearanceElements -> {}]

enter image description here

TODO: Adding banker's offers and player's deal/nodeal choices.

$\endgroup$
4
  • $\begingroup$ Oh my goodness... who else but the illustrious (yet anonymous) @kglr could pull off such a lovely interface so quickly! A hearty +1... and eager anticipation for the final touches! $\endgroup$ Commented Mar 12, 2021 at 16:53
  • $\begingroup$ ... BUT... perhaps the interface should have two modes. My original request was for an interface to play along with the TV game. As such, there is no need to scramble the contents of suitcases. We see what the on-TV player sees. It doesn't matter that it was a particular case number that revealed a dollar amount, just that a particular dollar amount was revealed. (A different mode is to "play against" a Mathematica version of the game. A nice addition, but not the original request.) $\endgroup$ Commented Mar 12, 2021 at 17:04
  • $\begingroup$ @DavidG.Stork, updated with a play-along version. $\endgroup$
    – kglr
    Commented Mar 12, 2021 at 18:11
  • $\begingroup$ Wonderful. Once the "banker's offer" (and perhaps a reset button?) are in, a hearty and grateful accept. $\endgroup$ Commented Mar 12, 2021 at 19:38

Your Answer

By clicking “Post Your Answer”, you agree to our terms of service and acknowledge you have read our privacy policy.

Not the answer you're looking for? Browse other questions tagged or ask your own question.