added 2108 characters in body
Source Link
kglr
  • 400.5k
  • 18
  • 488
  • 929

Update: To get a play-along version, remove BaseStyle -> ... from togglerGrid and RandomSample from the second control. Since right panel is now redundant we can remove it too.

ClearAll[togglerGrid2]
togglerGrid2[Dynamic[y_], vals_, dims_, size_: {20, 20}, col_: LightGray] := 
 Deploy @ Grid[ArrayReshape[Table[With[{i = i}, 
    Item[Setter[Dynamic[MemberQ[y, i], If[! MemberQ[y, i], AppendTo[y, i]] &], 
          {True}, i, Appearance -> None, Alignment -> Center, ImageSize -> size], 
       ItemSize -> {All, 1}, Frame -> White, FrameStyle -> Thick,
       Background -> Dynamic[If[MemberQ[y, i], Lighter@Lighter@col, col]]]], 
      {i,  vals}], dims, ""],
   Spacings -> {.1, .1}, Dividers -> All, 
   FrameStyle -> White, Alignment -> {Center, Center}, 
   ItemStyle -> FontSize -> 16]

Style[#, DefaultOptions -> {Panel -> {FrameStyle -> None, 
       Appearance -> "Frameless", Background -> ColorData["HTML", "Gold"]}}] &@
 Manipulate[Labeled[BoxWhiskerChart[
    PadRight[Complement[rs, Take[a, #]] & /@ Range[0, Length@a], 
     Length@values, {{}}], ScalingFunctions -> "Log", 
    Background -> White, ImageSize -> {600, 400}, Joined -> True, 
    ChartLabels -> Placed[Range[25], Axis], ChartStyle -> "Rainbow", 
    GridLines -> {{5, 10, 15, 20, 25}, None}], logo, Top], 
  Column[{Dynamic @ Panel @ Magnify[Show[briefcase, 
        Epilog -> Text[Style[Column[{Style["Expected Value", White, 
              FontSize -> Scaled[.1]], 
             Row[{"$ ", N@Mean[Complement[rs, a]]}]}, Alignment -> Center], 
          Red, FontSize -> Scaled[.15]], {3/2, 5/4}]], 1/3], 
    Control@{{a, {}, ""}, rs, togglerGrid2[#, rs, {13, 2}, {70, 30}] &}, 
    Control@{{rs, values}, None}}, Alignment -> Center], 
  ControlPlacement -> {Left, Right}, 
  Method -> {"ContentAreaBackground" -> ColorData["HTML", "Gold"]}, 
  AppearanceElements -> {}]

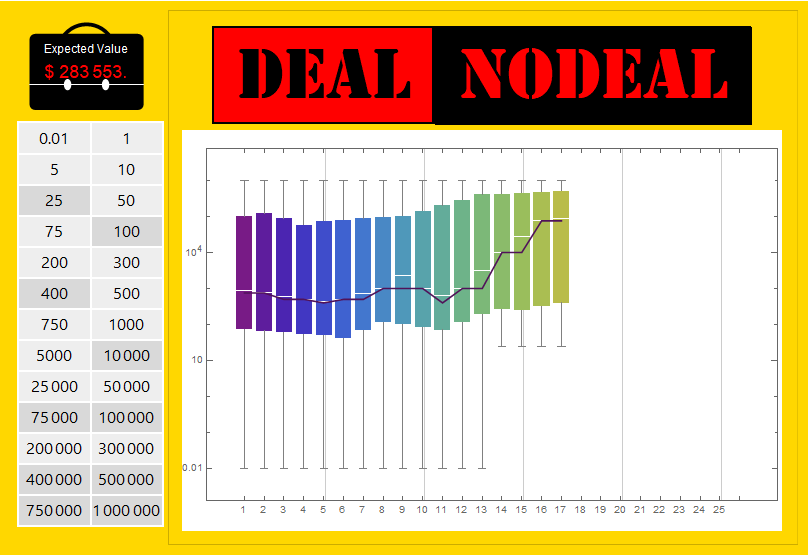
enter image description here

TODO: Adding banker's offers and player's deal/nodeal choices.

TODO: Adding banker's offers and player's deal/nodeal choices.
Update: To get a play-along version, remove BaseStyle -> ... from togglerGrid and RandomSample from the second control. Since right panel is now redundant we can remove it too.

ClearAll[togglerGrid2]
togglerGrid2[Dynamic[y_], vals_, dims_, size_: {20, 20}, col_: LightGray] := 
 Deploy @ Grid[ArrayReshape[Table[With[{i = i}, 
    Item[Setter[Dynamic[MemberQ[y, i], If[! MemberQ[y, i], AppendTo[y, i]] &], 
          {True}, i, Appearance -> None, Alignment -> Center, ImageSize -> size], 
       ItemSize -> {All, 1}, Frame -> White, FrameStyle -> Thick,
       Background -> Dynamic[If[MemberQ[y, i], Lighter@Lighter@col, col]]]], 
      {i,  vals}], dims, ""],
   Spacings -> {.1, .1}, Dividers -> All, 
   FrameStyle -> White, Alignment -> {Center, Center}, 
   ItemStyle -> FontSize -> 16]

Style[#, DefaultOptions -> {Panel -> {FrameStyle -> None, 
       Appearance -> "Frameless", Background -> ColorData["HTML", "Gold"]}}] &@
 Manipulate[Labeled[BoxWhiskerChart[
    PadRight[Complement[rs, Take[a, #]] & /@ Range[0, Length@a], 
     Length@values, {{}}], ScalingFunctions -> "Log", 
    Background -> White, ImageSize -> {600, 400}, Joined -> True, 
    ChartLabels -> Placed[Range[25], Axis], ChartStyle -> "Rainbow", 
    GridLines -> {{5, 10, 15, 20, 25}, None}], logo, Top], 
  Column[{Dynamic @ Panel @ Magnify[Show[briefcase, 
        Epilog -> Text[Style[Column[{Style["Expected Value", White, 
              FontSize -> Scaled[.1]], 
             Row[{"$ ", N@Mean[Complement[rs, a]]}]}, Alignment -> Center], 
          Red, FontSize -> Scaled[.15]], {3/2, 5/4}]], 1/3], 
    Control@{{a, {}, ""}, rs, togglerGrid2[#, rs, {13, 2}, {70, 30}] &}, 
    Control@{{rs, values}, None}}, Alignment -> Center], 
  ControlPlacement -> {Left, Right}, 
  Method -> {"ContentAreaBackground" -> ColorData["HTML", "Gold"]}, 
  AppearanceElements -> {}]

enter image description here

TODO: Adding banker's offers and player's deal/nodeal choices.
added 38 characters in body
Source Link
kglr
  • 400.5k
  • 18
  • 488
  • 929
Style[#, DefaultOptions -> {Panel -> {Background -> ColorData["HTML", "Gold"]}}] & @
 Manipulate[Labeled[
    BoxWhiskerChart[PadRight[Complement[rs, Take[a, #]] & /@ Range[0, Length@a], 
      Length@values Length @ values, {{}}], ScalingFunctions -> "Log", 
     Background -> White, ImageSize -> {600, 400}, Joined -> True, 
     ChartLabels -> Placed[Range[25], Axis], ChartStyle -> "Rainbow", 
     GridLines -> {{5, 10, 15, 20, 25}, None}], logo, Top], 
   Column[{Dynamic @ Panel @ Magnify[Show[briefcase, 
        Epilog -> Text[If[Length@Complement[rs, a] == 1, 
           Style[First @ rs , Red, FontSize -> Scaled[.15]], 
           Style["?" , Red, Bold, FontSize -> Scaled[.4]]], {3/2, 5/4}]], 1/3], 
    Control @ {{a, {}, ""}, rs, togglerGrid[#, Rest@rs, {13, 2}, {70, 30}] &}, 
     Control@{{rs, RandomSample[values]}, None}}, Alignment -> Center],
    Column[{Dynamic @ Panel @ Magnify[
       Show[briefcase, Epilog -> Text[Style[
           Column[{Style["Expected Value", White, FontSize -> Scaled[.1]], 
             Row[{"$ ", N @ Mean[Complement[rs, a]]}]}, 
            Alignment -> Center], Red, FontSize -> Scaled[.15]], {3/2, 5/4}]], 1/3], 
       Grid[Partition[Map[Item[Pane[Dynamic @ Style[#, 16,
            If[MemberQ[a, #], White, Black]], 
          ImageSize -> {70, 30}, Alignment -> {Right, Center}], 
         Background -> Dynamic @ If[MemberQ[a, #], ColorData["HTML", "Goldenrod"], 
            White]] &, Reverse @ values], 2],
     Spacings -> {.1, .1}, Dividers -> All, FrameStyle -> White]},
    Alignment -> Center], 
  ControlPlacement -> {Left, Right}, 
  Method -> {"ContentAreaBackground" -> ColorData["HTML", "Gold"]}, 
  AppearanceElements -> {}]

enter image description here

TODO: Adding banker's offers and player's deal/nodeal choices.

Style[#, DefaultOptions -> {Panel -> {Background -> ColorData["HTML", "Gold"]}}] & @
 Manipulate[Labeled[
    BoxWhiskerChart[PadRight[Complement[rs, Take[a, #]] & /@ Range[0, Length@a], 
      Length@values, {{}}], ScalingFunctions -> "Log", 
    Background -> White, ImageSize -> {600, 400}, Joined -> True, 
    ChartLabels -> Placed[Range[25], Axis], ChartStyle -> "Rainbow", 
    GridLines -> {{5, 10, 15, 20, 25}, None}], logo, Top], 
  Column[{Dynamic @ Panel @ Magnify[Show[briefcase, 
        Epilog -> Text[If[Length@Complement[rs, a] == 1, 
           Style[First @ rs , Red, FontSize -> Scaled[.15]], 
           Style["?" , Red, Bold, FontSize -> Scaled[.4]]], {3/2, 5/4}]], 1/3], 
    Control @ {{a, {}, ""}, rs, togglerGrid[#, Rest@rs, {13, 2}, {70, 30}] &}, 
    Control@{{rs, RandomSample[values]}, None}}, Alignment -> Center],
   Column[{Dynamic @ Panel @ Magnify[
       Show[briefcase, Epilog -> Text[Style[
           Column[{Style["Expected Value", White, FontSize -> Scaled[.1]], 
             Row[{"$ ", N @ Mean[Complement[rs, a]]}]}, 
            Alignment -> Center], Red, FontSize -> Scaled[.15]], {3/2, 5/4}]], 1/3], 
    Grid[Partition[Map[Item[Pane[Dynamic @ Style[#, 16, If[MemberQ[a, #], White, Black]], 
          ImageSize -> {70, 30}, Alignment -> {Right, Center}], 
         Background -> Dynamic @ If[MemberQ[a, #], ColorData["HTML", "Goldenrod"], 
            White]] &, Reverse @ values], 2],
     Spacings -> {.1, .1}, Dividers -> All, FrameStyle -> White]}, Alignment -> Center], 
  ControlPlacement -> {Left, Right}, 
  Method -> {"ContentAreaBackground" -> ColorData["HTML", "Gold"]}, 
  AppearanceElements -> {}]

enter image description here

Style[#, DefaultOptions -> {Panel -> {Background -> ColorData["HTML", "Gold"]}}] & @
 Manipulate[Labeled[
    BoxWhiskerChart[PadRight[Complement[rs, Take[a, #]] & /@ Range[0, Length@a], 
       Length @ values, {{}}], ScalingFunctions -> "Log", 
     Background -> White, ImageSize -> {600, 400}, Joined -> True, 
     ChartLabels -> Placed[Range[25], Axis], ChartStyle -> "Rainbow", 
     GridLines -> {{5, 10, 15, 20, 25}, None}], logo, Top], 
   Column[{Dynamic @ Panel @ Magnify[Show[briefcase, 
        Epilog -> Text[If[Length@Complement[rs, a] == 1, 
           Style[First @ rs , Red, FontSize -> Scaled[.15]], 
           Style["?" , Red, Bold, FontSize -> Scaled[.4]]], {3/2, 5/4}]], 1/3], 
    Control @ {{a, {}, ""}, rs, togglerGrid[#, Rest@rs, {13, 2}, {70, 30}] &}, 
     Control@{{rs, RandomSample[values]}, None}}, Alignment -> Center],
    Column[{Dynamic @ Panel @ Magnify[
       Show[briefcase, Epilog -> Text[Style[
           Column[{Style["Expected Value", White, FontSize -> Scaled[.1]], 
             Row[{"$ ", N @ Mean[Complement[rs, a]]}]}, 
            Alignment -> Center], Red, FontSize -> Scaled[.15]], {3/2, 5/4}]], 1/3], 
       Grid[Partition[Map[Item[Pane[Dynamic @ Style[#, 16,
            If[MemberQ[a, #], White, Black]], 
          ImageSize -> {70, 30}, Alignment -> {Right, Center}], 
         Background -> Dynamic @ If[MemberQ[a, #], ColorData["HTML", "Goldenrod"], 
            White]] &, Reverse @ values], 2],
     Spacings -> {.1, .1}, Dividers -> All, FrameStyle -> White]},
    Alignment -> Center], 
  ControlPlacement -> {Left, Right}, 
  Method -> {"ContentAreaBackground" -> ColorData["HTML", "Gold"]}, 
  AppearanceElements -> {}]

enter image description here

TODO: Adding banker's offers and player's deal/nodeal choices.

added 362 characters in body
Source Link
kglr
  • 400.5k
  • 18
  • 488
  • 929

We need a custom control because TogglerBar does not quite do the job as it shows the value that is being clicked and it allows opened briefcases to be closed again with the next click. With the function togglerGrid below (1) once a briefcase is opened it remains open and (2) we cannot see the contents of the briefcase until it is opened, and (2) once a briefcase is opened it remains open.

... and a Manipulate:

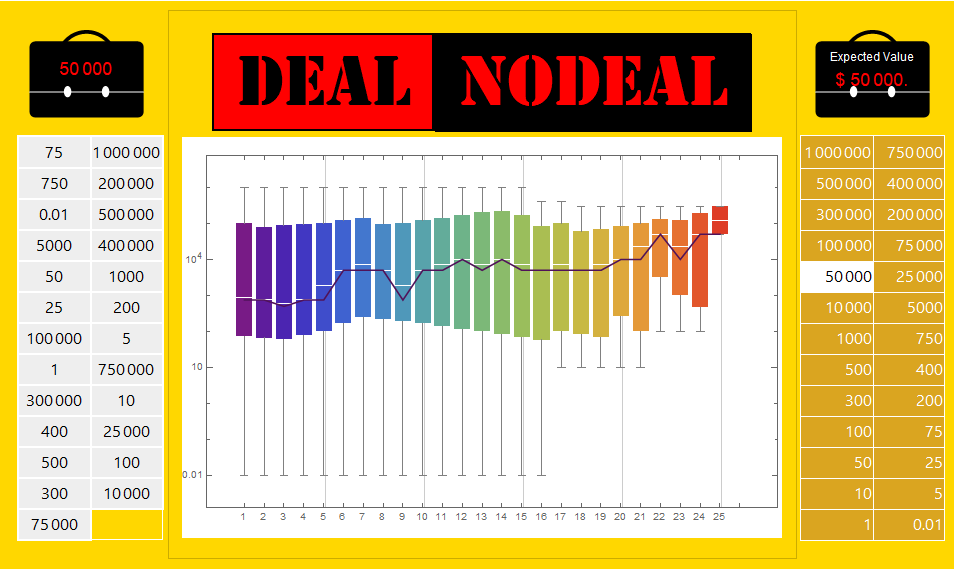
We shuffle values as initialization and assume the first briefcase is the one taken by the player. We update the data sets fed into BoxWhiskerChart as the remaining briefcases are opened. The top-right briefcase shows the expected value of currently closed briefcases. We use log-scaling in BoxWhiskerChart because with linear scaling the charts look too squeezed at the bottom.

We need a custom control because TogglerBar does not quite do the job as it allows opened briefcases to be closed again with the next click. With the function togglerGrid below (1) once a briefcase is opened it remains open and (2) we cannot see the contents of the briefcase until it is opened.

... and a Manipulate:

We need a custom control because TogglerBar does not quite do the job as it shows the value that is being clicked and it allows opened briefcases to be closed again with the next click. With the function togglerGrid below (1) we cannot see the contents of the briefcase until it is opened, and (2) once a briefcase is opened it remains open.

... and a Manipulate:

We shuffle values as initialization and assume the first briefcase is the one taken by the player. We update the data sets fed into BoxWhiskerChart as the remaining briefcases are opened. The top-right briefcase shows the expected value of currently closed briefcases. We use log-scaling in BoxWhiskerChart because with linear scaling the charts look too squeezed at the bottom.

Source Link
kglr
  • 400.5k
  • 18
  • 488
  • 929
Loading