1
$\begingroup$

I am finding a local maximum of a curve and I want to make the plot easier to read. I added a point to where the maximum is but I would also like to:

1) add a tick with text below it where the x value of the maximum is (saying "Xmax" or " X* ")

2) a dotted line from the point down to the x-axis.

Here is a simpler version of the plot I'm making:

maxi = FindMaximum[Cos[x], {x, 4, 8}];
coordin = {x /. maxi[[2]], First[maxi]};
Plot[Cos[x], {x, 0, 4 \[Pi]}, Epilog -> {PointSize[Large], Point[coordin]}]

I have pictures to better explain this but I'm not allowed to post images.

$\endgroup$
1
  • 1
    $\begingroup$ "I have pictures to better explain this but I'm not allowed to post images." - maybe post a link to your images, and I (or somebody else) will put them in for you. $\endgroup$ Commented Apr 23, 2013 at 15:04

1 Answer 1

2
$\begingroup$

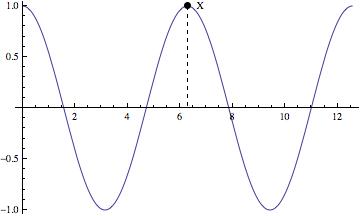
Is this what you want?

maxi = FindMaximum[Cos[x], {x, 4, 8}];
coordin = {x /. maxi[[2]], First[maxi]};
Plot[Cos[x], {x, 0, 4 \[Pi]}, 
 Epilog -> {PointSize[Large], Point[coordin], Dashed, 
   Line[{coordin, {coordin[[1]], 0}}], Text["X", coordin + {0.5, 0}]}]

enter image description here

$\endgroup$
3
  • $\begingroup$ :) close! how do you put the "X" below the x axis? $\endgroup$
    – LiaChica
    Commented Apr 23, 2013 at 15:26
  • 1
    $\begingroup$ How about change Text["X", coordin + {0.5, 0}] to Text["X", {coordin[[1]], -0.1}]? $\endgroup$
    – user0501
    Commented Apr 23, 2013 at 15:29
  • $\begingroup$ Got it! Thank you! :-) $\endgroup$
    – LiaChica
    Commented Apr 24, 2013 at 10:31

Your Answer

By clicking “Post Your Answer”, you agree to our terms of service and acknowledge you have read our privacy policy.

Not the answer you're looking for? Browse other questions tagged or ask your own question.