2
$\begingroup$

I have a single ODE of the form

x'[t] = -(y*n*n + z*n) x[t] + w (1-x[t]) x[t]

where the second part of the ODE is the logistic growth with the maximum allowed population set to 1 and growth rate equals to w.

The first part is some sort of polynomial exploitation/growth function whose effect is defined according to y, z and n.

I am only interested in the values of x[t] within the range [0, 1].

I am able to plot and manipulate the stream plot for it:

x'[t] == f[t, x[t]];
fo1[t_, x_] := -x*(y*n^2 + z*n) + w (1 - x) x /. {w -> 1};
Manipulate[
  Show[
    StreamPlot[{1, fo1[t, x] /. {y -> my, z -> mz, n -> mn}}, {t, 0,25}, {x, -0.25, 1.25}, 
    VectorPoints -> Automatic, 
    VectorStyle -> Black, StreamStyle -> Orange, 
    VectorStyle -> Arrowheads[0.01], ImageSize -> Medium, 
    PlotRange -> {{0, 25}, {-0.25, 1.15}}]],
  {{mn, 1, "[0,100]"}, 0, 1},
  {{mz, 1.05, "[-1,1]"}, -2, 2},
  {{my, -0.345, "[-1,1]"}, -2, 2}]

from which it can be seen that according to the parameter y, z and n (assuming w ia fixed) the number and type of the critical points change.

With the given values, for instance, there is an unstable point at 0 and a stable point at ~0.3

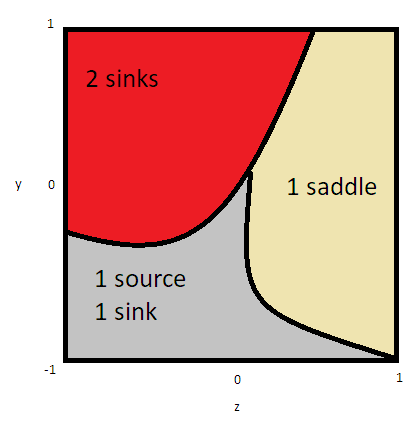
What I would like to achieve is a parametric plot with two of the above parameters on the Cartesian axes (e.g., y and z) and which divides the plot into regions according to the number of critical points present in it. If possible, I would also like to each region with its type.

For instance something like what is shown in the figure below:

plot example

So far I am not able to go any further than making the stream plot. I have no idea on how to proceed.

Any help is appreciated.

$\endgroup$
9
  • $\begingroup$ You could use ParametricNDSolve. What is the initial value x[0]? The condition for a critical point is x'[t]=0 ? $\endgroup$ Commented Jan 7, 2019 at 21:15
  • 1
    $\begingroup$ Is u[t] supposed to be x[t]? $\endgroup$
    – Michael E2
    Commented Jan 7, 2019 at 21:21
  • 1
    $\begingroup$ The ODE seems to have a 1D phase space -- there are no saddles. Generically, you have either 1 source/1 sink. $\endgroup$
    – Michael E2
    Commented Jan 7, 2019 at 21:34
  • $\begingroup$ @MichaelE2 yes, I apologize for the mistake. And yes I know that there is no saddle in this specific case. Thanks. $\endgroup$
    – Dario
    Commented Jan 8, 2019 at 9:17
  • $\begingroup$ @UlrichNeumann the initial value x[0] might have different values. But for now, it is okay to fix it (e.g. 0.5). $\endgroup$
    – Dario
    Commented Jan 8, 2019 at 9:29

1 Answer 1

1
$\begingroup$

Analysis is easier if we define a new compound parameter, c=y*n*n + z*n. The resulting equation is still a logistic equation, with two equilibria:

Solve[0 == -c x + (1 - x) x, x]
(* {{x -> 0}, {x -> 1 - c}} *)

The trivial equilibrium is unstable when $c<1$ and stable when $c>1$. The latter situation corresponds to the second equilibrium being negative, so that's the condition for one vs two meaningful (non-negative) equilibria.

Now we can substitute the definition of c in terms of y and z to solve for the critical boundary between these cases:

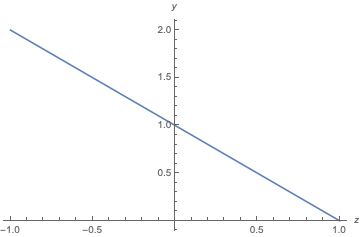
Solve[1 == (y*n^2 + z*n), y]
(* {{y -> (1 - n z)/n^2}} *)

This is a line, which looks like:

n=1;
Plot[(1 - n z)/n^2, {z, -1, 1}, AxesLabel -> {z, y}]

Mathematica graphics

Above the line, there is only x=0 which is stable. Below the line, x=0 is unstable and there is a positive, stable equilibrium.

$\endgroup$

Your Answer

By clicking “Post Your Answer”, you agree to our terms of service and acknowledge you have read our privacy policy.

Not the answer you're looking for? Browse other questions tagged or ask your own question.