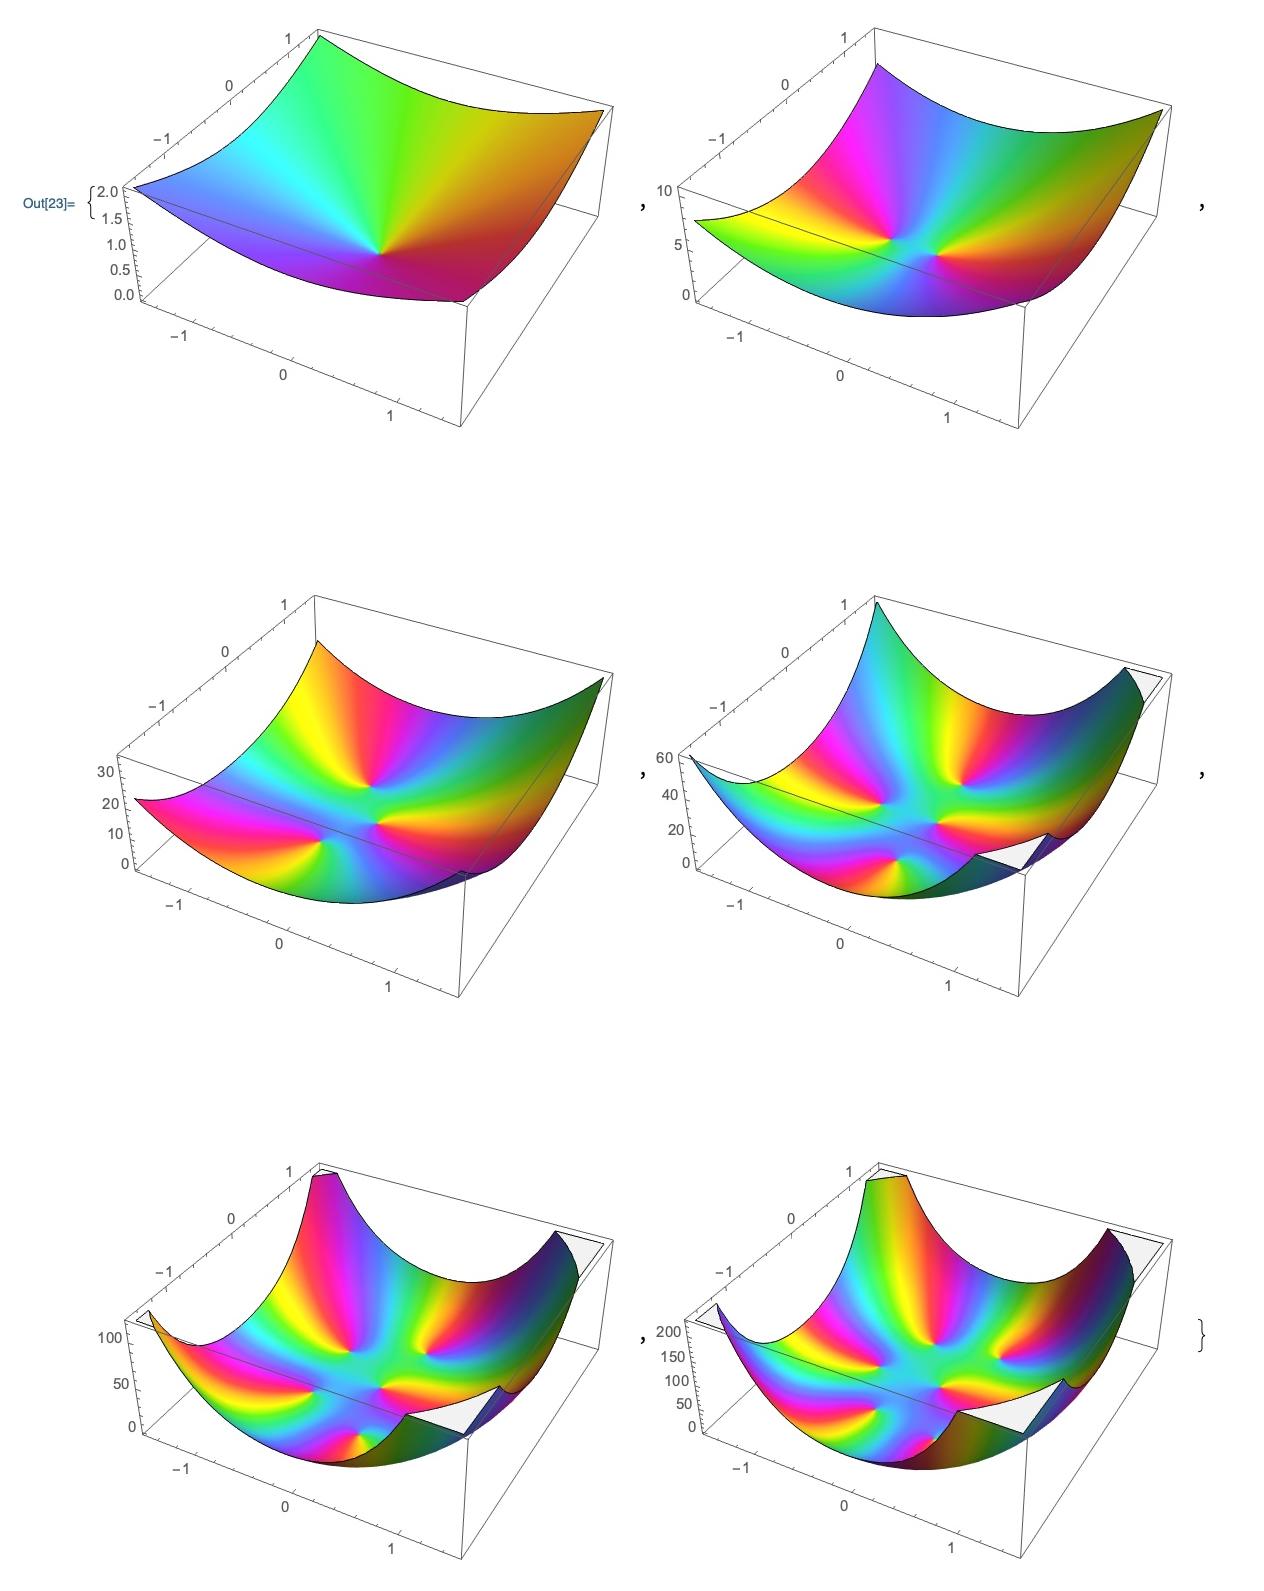
I have a Table of 6 plots of polynomials of increasing degree, using ComplexPlot3D:
Clear["Global`*"];
poly[z_] := Sum[k*z^k, {k, 1, n}];
Table[ComplexPlot3D[poly[z], {z, -1.5 - 1.5*I, 1.5 + 1.5*I}], {n, 1, 6}]
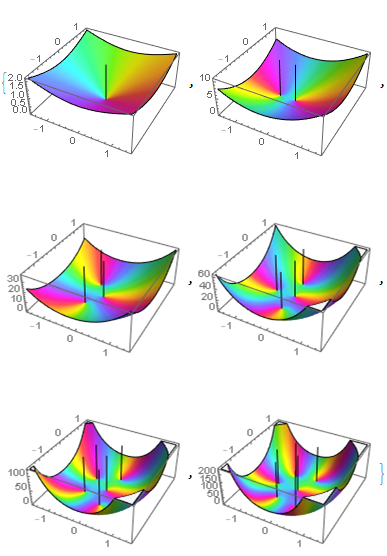
I would like to add a black vertical line passing through each root of the polynomials. You can kind of see where they are from the plots, but lines would be a helpful visualisation aid.
I can obtain the roots easily enough:
Table[{poly[z], Roots[poly[z] == 0, z]}, {n, 1, 6}]
But how do I convert the data provided by Roots into vertical lines? Ultimately, I want to be able to do this for polynomials of arbitrary degree, so a 'manual' solution isn't much help.
Thanks in advance, and stay safe.


