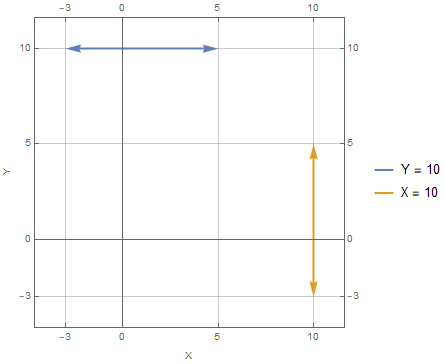
If I run:
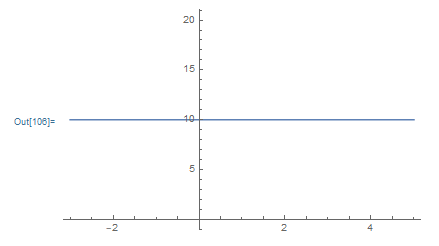
Plot[y = 10, {x, -3, 5}]
output:
If I run:
Plot[x = 10, {y, -3, 5}]
I am getting exactly same output as in first case.
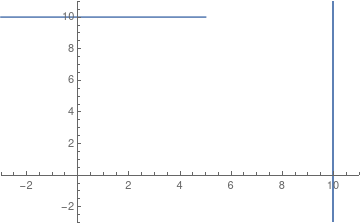
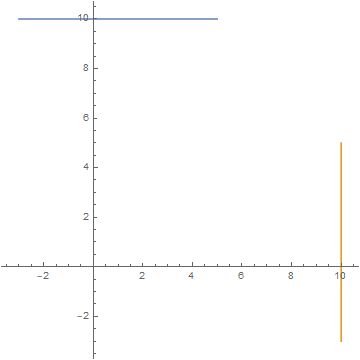
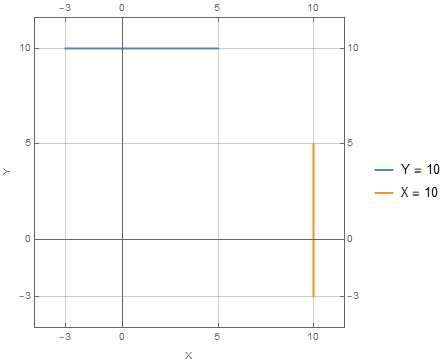
I need:
- To plot
y=10andx from -3 to 5 - To plot
x=10andy from -3 to 5
How can I do that and what I am doing wrong?

