3
$\begingroup$

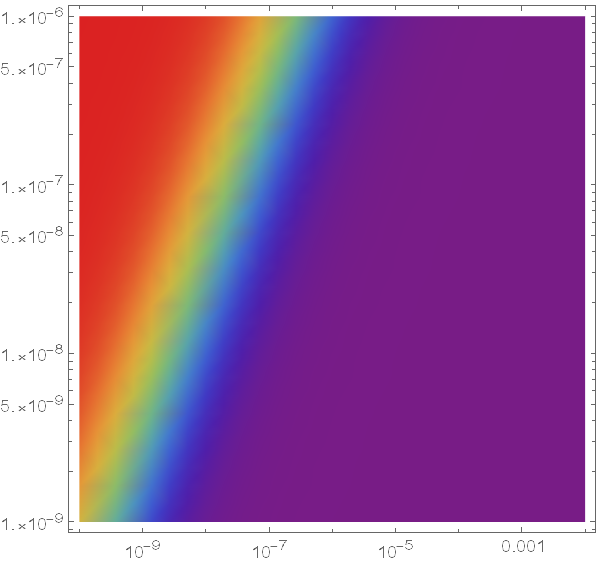
Could anyone help me to add the minor Log ticks to the X-axis of this Plot? Thank you so much!

DensityPlot[
 20*y/(0.2 y + 0.8 x), {x, 1/10^10, 1/10^2}, {y, 1/10^9, 1/10^6}, 
 ScalingFunctions -> {"Log", "Log"}, Ticks -> {Automatic}, 
 ColorFunction -> "Rainbow"]

I've tried many ways but none of them worked out. I'm still learning this. Thank you.enter image description here

$\endgroup$

1 Answer 1

3
$\begingroup$
dp = DensityPlot[20*y/(0.2 y + 0.8 x), {x, 1/10^10, 1/10^2}, {y, 1/10^9, 1/10^6}, 
   ScalingFunctions -> {"Log", "Log"}, ColorFunction -> "Rainbow"];

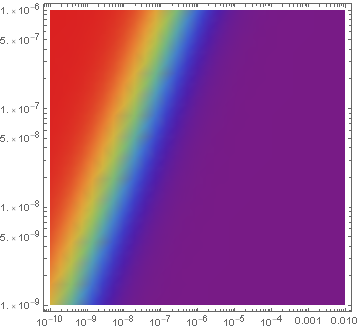
Post-process dp to change the default number of major and minor ticks ({6,6}) to {8,6} for the bottom and top frames:

Replace[dp, {vt : {_, _}, {bt : Charting`ScaledTicks[{Log, Exp}], 
    tt_}} :> {vt, {bt[#, #2, {8, 6}] &, tt[#, #2, {8, 6}] &}}, All]
enter image description here

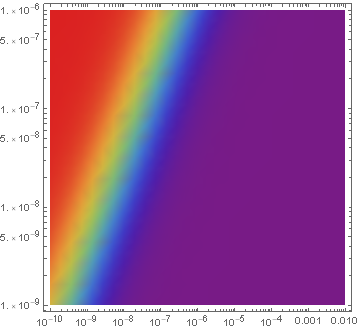
Alternatively,

{leftticks, rightticks} = #[{Log, Exp}][Log[1/10^9], Log[1/10^6], {6, 6}] & /@ 
    {Charting`ScaledTicks, Charting`ScaledFrameTicks};
{bottomticks, topticks} = #[{Log, Exp}][Log[1/10^10], Log[1/10^2], {8, 6}] & /@
    {Charting`ScaledTicks, Charting`ScaledFrameTicks};

Show[dp, FrameTicks -> {{leftticks, rightticks}, {bottomticks, topticks}}]
enter image description here

$\endgroup$
2
  • $\begingroup$ Thank you! X-axis scale of the second approach seems to be different. $\endgroup$ Commented Sep 6, 2020 at 15:35
  • 1
    $\begingroup$ @ShawnYoung, fixed now. $\endgroup$
    – kglr
    Commented Sep 6, 2020 at 15:42

Your Answer

By clicking “Post Your Answer”, you agree to our terms of service and acknowledge you have read our privacy policy.

Not the answer you're looking for? Browse other questions tagged or ask your own question.