4
$\begingroup$

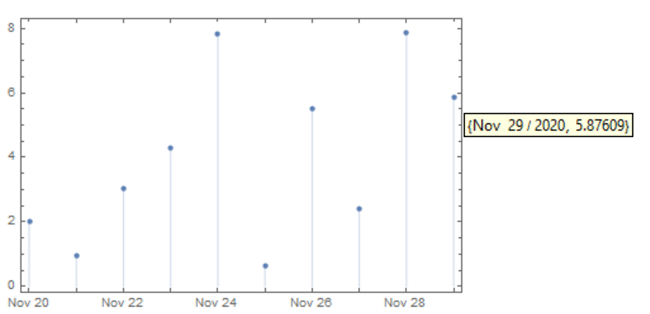
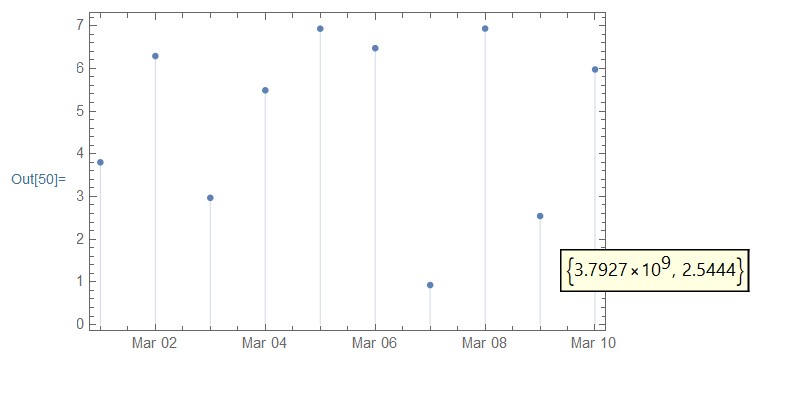
I would like to use Tooltip on a TimeSeries from within DateListPlot with a human readable date format (eg, "Mar 1, 2020") rather that AbsoluteTime. Tooltip works, but I've been unable to find a way to show anything other that AbsoluteTime. Is there a way to display a more human readable date?

Here is some example code:

vals = RandomReal[10, 10];
ts = TimeSeries[vals, {{2020, 3, 1}}];
DateListPlot[Tooltip@ts, Joined -> False, Filling -> Axis]

Example Plot

$\endgroup$

1 Answer 1

7
$\begingroup$
DateListPlot[Tooltip[#,
   {DateString[First @ #, { "MonthNameShort", "  ", "Day", " / ", "Year"}], 
    Last @ #}] & /@ ts["Path"], Joined -> False, Filling -> Axis]

enter image description here

$\endgroup$

Your Answer

By clicking “Post Your Answer”, you agree to our terms of service and acknowledge you have read our privacy policy.

Not the answer you're looking for? Browse other questions tagged or ask your own question.