Bug introduced in 10.0 or earlier and solved in 10.4
Bug introduced in 10.0 or earlier and persisting through 11.0.1 or later
First bug. See output of DateListPlot[%]
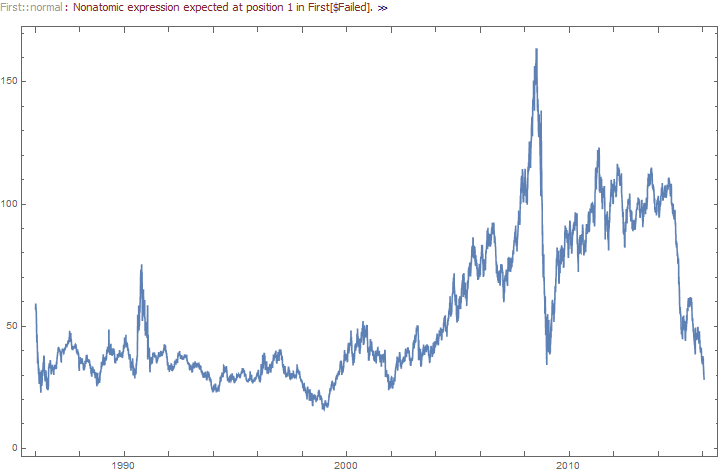
Second bug. See output of DateListPlot[wtiInflationAdjusted["Path"]]
Ran across this (possible bug) today.
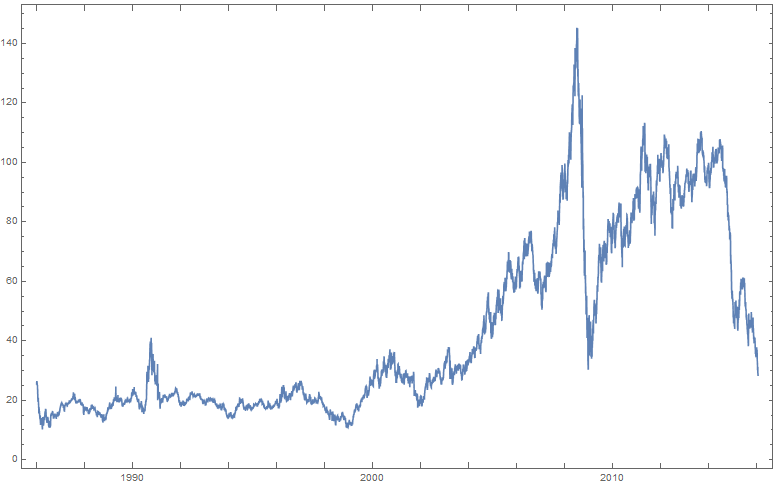
Here's historical West Texas Intermediate oil prices:
wti = TimeSeries[Import["https://www.eia.gov/dnav/pet/hist_xls/RWTCd.xls", "XLS"][[2, 4 ;; -2]]];
wti = TimeSeriesMap[Quantity[#, "USDollars"] &, wti]
It plots nicely.
DateListPlot[wti]

Now to put the data in 2016 dollars and plot:
wtiInflationAdjusted = InflationAdjust[wti, {2016, 1, 1}];
DateListPlot[%]
And, well, it fails spectacularly for MMA 10.3 on Win7 x64 (also happens on OS X).
We can go about it another way:
DateListPlot[wtiInflationAdjusted["Path"]]
...and we actually get a plot, albeit with a $Failed error thrown in:

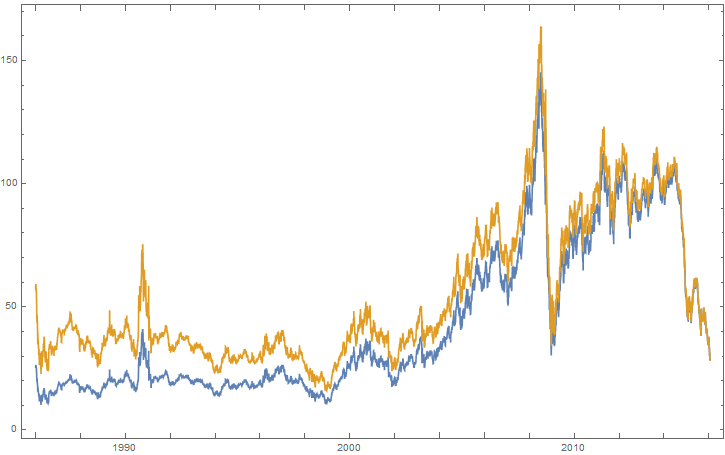
The only way I can get around an error is to do a ridiculous Quantity conversion:
take2 = TimeSeriesMap[
 Quantity[QuantityMagnitude[#], "USDollars"] &, InflationAdjust[wti, {2016, 1, 1}]];
DateListPlot[{wti, take2}]

Any ideas? User error or bug?

bugstag since this post got a sarcastically-huge amount of interest! $\endgroup$DateListPlot[%]) is solved as of 10.4; the second (error message ofFirst) persists through 11.0.1 or later. In case the latter should not be considered as a bug, please remove the corresponding parts in the header. $\endgroup$