1
$\begingroup$

Given a TimeSeries, ts, how can I compute the percentage change from one period to the next? Percentage change is calculated as (x[n] - x[n-1])/x[n-1] * 100.0. I've tried experimenting with MovingMap and pure functions but without success.

I can get the percentage change as a list of values with:

pc = MovingMap[(#[[2]] - #[[1]])/#[[1]] * 100.0 &, ts["Values"], {2}]

pc can then be plotted with ListLinePlot, but I'd really like to get back a TimeSeries object that can be plotted with DateListPlot.

$\endgroup$

2 Answers 2

3
$\begingroup$

It matters if your TimeSeries is RegularlySampledQ or not. If it is, then you can use

f = If[PossibleZeroQ[#1], Missing["Indeterminate"], 100 (#2 - #1) / #1]&;
MovingMap[f @@ #Values &, ts, {1, Right}]

otherwise you can use

MovingMap[f @@ #Values &, ts, {Quantity[2, "Events"], Right}]

where f is defined as in the previous code block. This time though, you are calculating a percentage difference that is not commensurate along the series, as it corresponds to different time spans.

$\endgroup$
1
  • $\begingroup$ The TimeSeries comes from FinancialData and appears not to be RegularlySampledQ. Simplifying to: MovingMap[100 (#2 - #1) / #1 & @@ #Values &, ts, {Quantity[2, "Events"], Right}] works nicely. Thank you. $\endgroup$
    – Lee
    Commented Apr 9, 2018 at 16:59
1
$\begingroup$

Not too hard:

ts = TimeSeries[FinancialData["SBUX", "2016"]];
pc = TimeSeries[100. Differences[#]/Most[#] &[ts["Values"]], {Rest[ts["Dates"]]}];

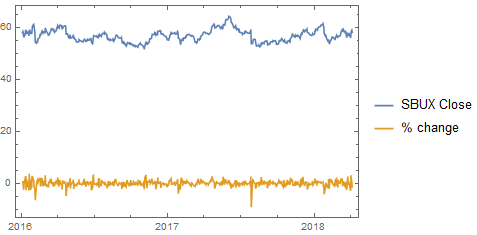
DateListPlot[{ts, pc}, PlotLegends -> {"SBUX Close", "% change"}]

time series and its percentage change

$\endgroup$
1
  • $\begingroup$ Thank you. The computation of pc is elegant and a nice expression of the Wolfram Language. $\endgroup$
    – Lee
    Commented Apr 9, 2018 at 17:03

Your Answer

By clicking “Post Your Answer”, you agree to our terms of service and acknowledge you have read our privacy policy.

Not the answer you're looking for? Browse other questions tagged or ask your own question.