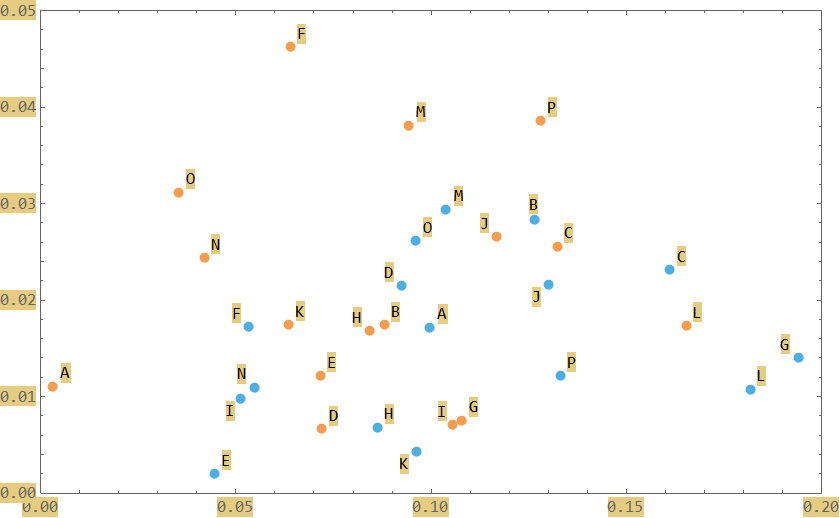
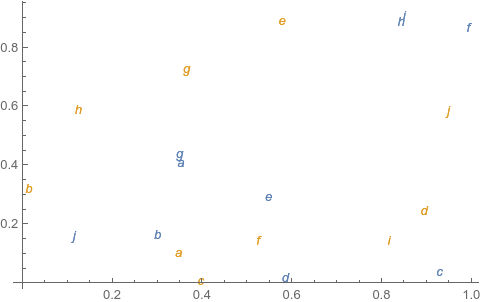
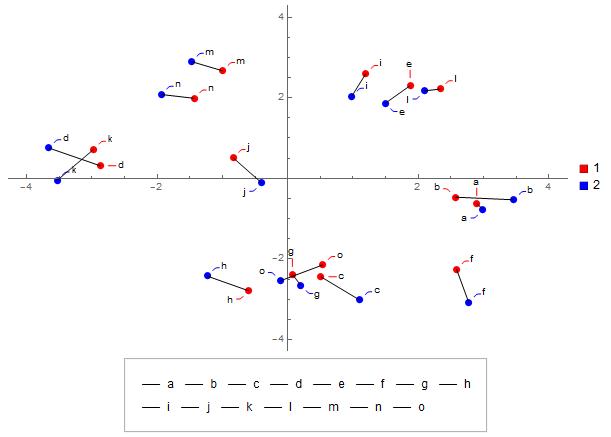
I have two lists of 2D data I would like to plot on a plane. These lists are of the same length n and are position-correlated to each other.
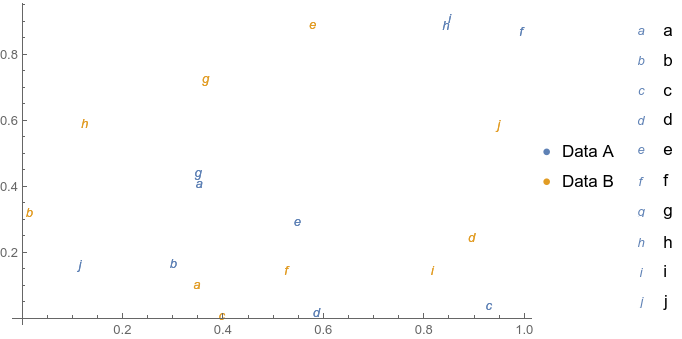
I need these lists to have two different colors, but share the same symbol for elements at position i in both lists.
For example, in the following image, the points with the same label should share the same symbol.
I have been struggling with ListPlot without success.
EDIT:
Is it possible to have two plot legends? One for the color and another for the symbol?


