2
$\begingroup$

I have data from similar function that are not evaluated on the same points. I would like to plot the points and the curves that are the upper and lower bounds of them. As an example consider the following code:

f[x_, r1_, r2_] := 1/((x + (2 r1 - 1)/2)^2 + r2 + 1)
SeedRandom[3]
points = {};
rs = Table[{RandomReal[], RandomReal[]}, {20}];
Do[
 p = RandomReal[{-2, 2}, {50}];
 v = f[#, rs[[i, 1]], rs[[i, 2]]] & /@ p;
 points = Join[points, Transpose[{p, v}]];
 , {i, 20}]
points = RandomSample[points];

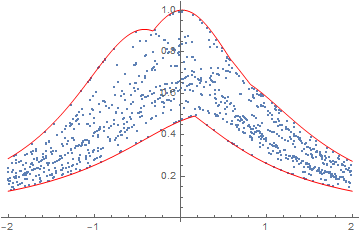
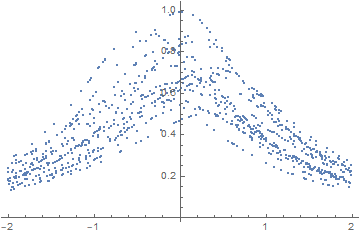
The ListPlot of these points is:

enter image description here

Clearly, in this example since we know the functions that create the points it is easy to get the upper and lower bounds:

enter image description here

But if we know only the points, is there any easy way to get these curves (or some others that are relatively close to those)?

$\endgroup$
4
  • 1
    $\begingroup$ There are a couple of errors in your code, I think. First of all, the 2nd-to-last line is floating by itself and should either be deleted or attached to whatever missing code is there. Next, your points has some entries that depend on the symbol r1, which isn't defined. $\endgroup$
    – march
    Commented Sep 26, 2019 at 17:40
  • 1
    $\begingroup$ See this question $\endgroup$
    – Alan
    Commented Sep 26, 2019 at 17:44
  • $\begingroup$ @march you were right. I mispasted code. I fixed it now. Thanks $\endgroup$
    – tst
    Commented Sep 26, 2019 at 18:36
  • $\begingroup$ I think there is a lack of definition of what the upper and lower bounds are when the curves are not known. For example, why should there be that large change in slope of the upper bound around (-0.4, 0.9). Why shouldn't it be smoother in that area? I think you'd need to come up with an operational definition for which points should be on the borders and then how much smoothing should be applied (which will be somewhat arbitrary - meaning others might use different rules) and see if that matches what you think it should look like. $\endgroup$
    – JimB
    Commented Sep 26, 2019 at 21:58

1 Answer 1

3
$\begingroup$

Without the curves identified (both as to collection of points and functional form of curves) there is going to be a lot of arbitrariness and tuning parameters. Here's one approach:

(* Bandwidth *)
w = 0.4;

(* Range of x values to consider *)
{xmin, xmax} = MinMax[points[[All, 1]]]
x0 = xmin - w/2.2  (* Adjustment of min and max to have the extreme points included *)
x1 = xmax + w/2.2
range = x1 - x0;
n = 100;  (* Number of grid points *)

(* Table of points near each equally spaced grid point *)
t = Table[
  Select[points, 
   x0 + range i/n - w/2 <= #[[1]] < x0 + range i/n + w/2 &], {i, 0, 
   n}];

(* Choose upper and lower points *)
upper = DeleteDuplicates[Table[Flatten[Select[t[[i]],
     #[[2]] == Max[t[[i, All, 2]]] &]], {i, Length[t]}]]
lower = DeleteDuplicates[Table[Flatten[Select[t[[i]],
     #[[2]] == Min[t[[i, All, 2]]] &]], {i, Length[t]}]]

(* Plot results *)
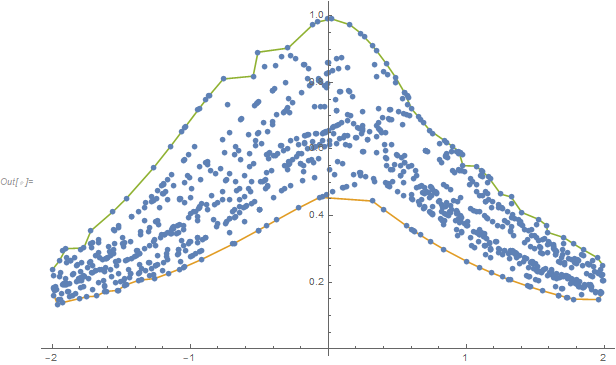
ListPlot[{points, lower, upper}, Joined -> {False, True, True},
 PlotStyle -> {PointSize[0.01], PointSize[0.02], PointSize[0.02]},
 ImageSize -> Large]

Min and max envelope of points

You'll then need to decide if smoothing needs to be added (another missing piece in the definition of what is meant by the upper and lower boundaries).

$\endgroup$

Your Answer

By clicking “Post Your Answer”, you agree to our terms of service and acknowledge you have read our privacy policy.

Not the answer you're looking for? Browse other questions tagged or ask your own question.