deleted 149 characters in body
Source Link
tst
  • 953
  • 6
  • 14

I have data from similar function that are not evaluated on the same points. I would like to plot the points and the curves that are the upper and lower bounds of them. As an example consider the following code:

f[x_, r1_, r2_] := 1/((x + (2 r1 - 1)/2)^2 + r2 + 1)
SeedRandom[3]
points = {};
rs = Table[{RandomReal[], RandomReal[]}, {20}];
Do[
 p = RandomReal[{-2, 2}, {50}];
 v = f[#, rs[[i, 1]], rs[[i, 2]]] & /@ p;
 points = Join[points, Transpose[{p, v}]];
 , {i, 20}]
points = RandomSample[points];
 r2 = RandomReal[];
 v = f[#, r1, r2] & /@ p;
 points = Join[points, Transpose[{p, v}]];
 , {20}]
points = RandomSample[points];

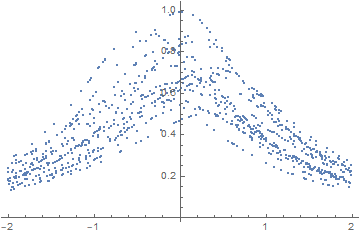
The ListPlot of these points is:

enter image description here

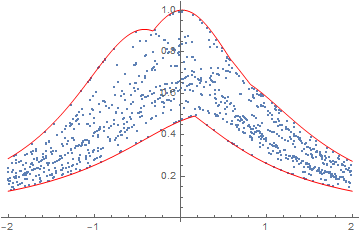
Clearly, in this example since we know the functions that create the points it is easy to get the upper and lower bounds:

enter image description here

But if we know only the points, is there any easy way to get these curves (or some others that are relatively close to those)?
I have data from similar function that are not evaluated on the same points. I would like to plot the points and the curves that are the upper and lower bounds of them. As an example consider the following code:

f[x_, r1_, r2_] := 1/((x + (2 r1 - 1)/2)^2 + r2 + 1)
SeedRandom[3]
points = {};
rs = Table[{RandomReal[], RandomReal[]}, {20}];
Do[
 p = RandomReal[{-2, 2}, {50}];
 v = f[#, rs[[i, 1]], rs[[i, 2]]] & /@ p;
 points = Join[points, Transpose[{p, v}]];
 , {i, 20}]
points = RandomSample[points];

The ListPlot of these points is:

enter image description here

Clearly, in this example since we know the functions that create the points it is easy to get the upper and lower bounds:

enter image description here

But if we know only the points, is there any easy way to get these curves (or some others that are relatively close to those)?

Source Link
tst
  • 953
  • 6
  • 14

Upper and lower bounds or points that do not align

I have data from similar function that are not evaluated on the same points. I would like to plot the points and the curves that are the upper and lower bounds of them. As an example consider the following code:

f[x_, r1_, r2_] := 1/((x + (2 r1 - 1)/2)^2 + r2 + 1)
SeedRandom[3]
points = {};
rs = Table[{RandomReal[], RandomReal[]}, {20}];
Do[
 p = RandomReal[{-2, 2}, {50}];
 v = f[#, rs[[i, 1]], rs[[i, 2]]] & /@ p;
 points = Join[points, Transpose[{p, v}]];
 , {i, 20}]
points = RandomSample[points];
 r2 = RandomReal[];
 v = f[#, r1, r2] & /@ p;
 points = Join[points, Transpose[{p, v}]];
 , {20}]
points = RandomSample[points];

The ListPlot of these points is:

enter image description here

Clearly, in this example since we know the functions that create the points it is easy to get the upper and lower bounds:

enter image description here

But if we know only the points, is there any easy way to get these curves (or some others that are relatively close to those)?