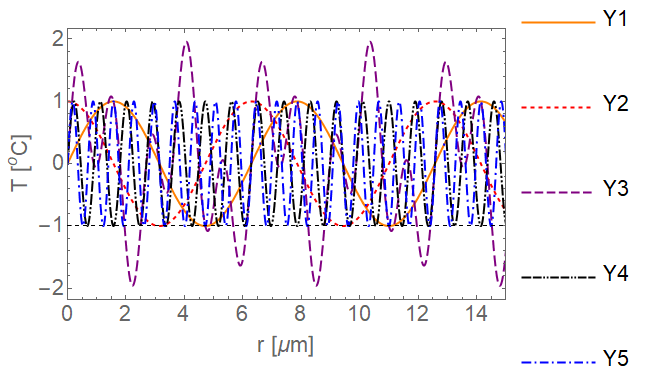
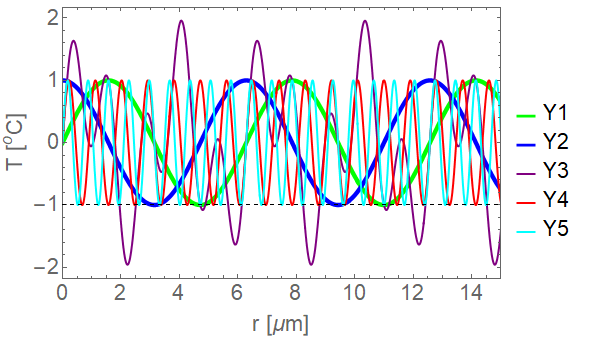
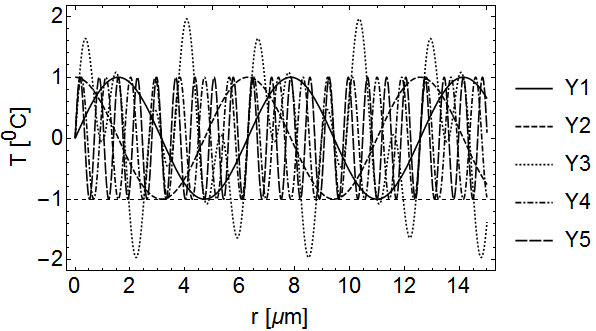
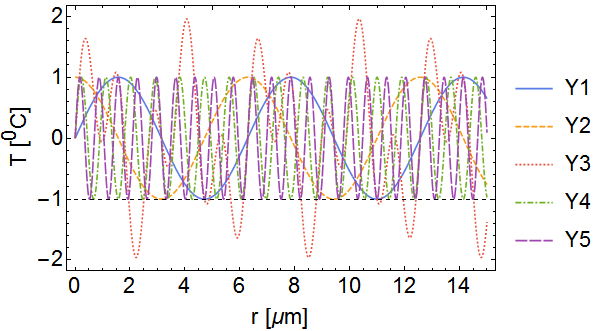
I constructed a plot with extra legends generated using dashed function but customarily defined legend doesn't look like plot:
Y1 = Sin[x]; Y2 = Cos[x]; Y3 = Sin[2*x] + Sin[5*x]; Y4 =
 Sin[7*x]; Y5 = Sin[9*x];
 Plot[{Y1, Y2, Y3, Y4, Y5}, {x, 0, 15}, Frame -> True,
 PlotRange -> {{0, 15}, All}, Axes -> {True, True},
 PlotLegends -> {Style["Y1", Plain, FontFamily -> Helvetica, 22],
 Style["Y2", Plain, FontFamily -> Helvetica, 22],
 Style["Y3", Plain, FontFamily -> Helvetica, 22],
 Style["Y4", Plain, FontFamily -> Helvetica, 22],
 Style["Y5", Plain, FontFamily -> Helvetica, 22]},
 AxesOrigin -> {0, -1}, AxesStyle -> Dashed,
 FrameLabel -> {"r [\[Mu]m]",
 "T [\!\(\*SuperscriptBox[\(\[InvisiblePrefixScriptBase]\), \(0\)]\
 \)C]"}, BaseStyle -> {FontSize -> 22, FontWeight -> Plain,
 FontFamily -> Helvetica},
 PlotStyle -> {Directive[Orange, Thick],
 Directive[Dashed, Red, Thick],
 Directive[Dashing[{0.025, 0.01, 0.025, 0.01}], Purple, Thick],
 Directive[Black,
 Dashing[{0.025, 0.005, 0.025, 0.005, 0.005, 0.005, 0.005,
 0.005}], Thick],
 Directive[Blue, Dashing[{0.025, 0.01, 0.005, 0.01}], Thick]},
 ImageSize -> 500]
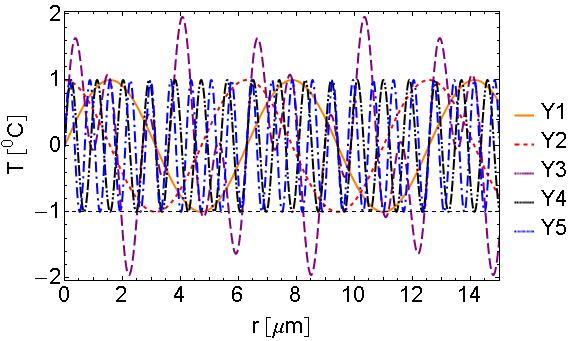 Note legend 3,4,5 are not like the plot or defining parameters.

