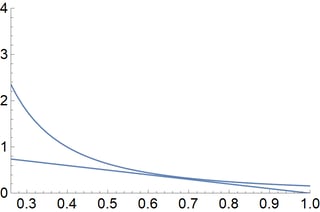
I have:
Show[Plot[1/(2 Pi x^2), {x, 0.26, 1}, PlotRange -> {{0.26, 1}, {0, 4}}], Plot[1 - x, {x, 0.26, 1}, PlotRange -> {{0.26, 1}, {0, 4}}],
LabelStyle -> {16, GrayLevel[0]}, AxesOrigin -> {0.26, 0}]
Why the origin $0.26$ (on the horizontal axis) doesn't appear in plot? ($0$ in the vertical axis is fine.)
EDIT
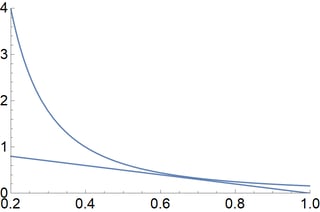
In the case where the origin is $(0.2, 0)$, the plot is fine:
Show[Plot[1/(2 Pi x^2), {x, 0.2, 1}, PlotRange -> {{0.2, 1}, {0, 4}}], Plot[1 - x, {x, 0.2, 1}, PlotRange -> {{0.2, 1}, {0, 4}}],
LabelStyle -> {16, GrayLevel[0]}, AxesOrigin -> {0.2, 0}]


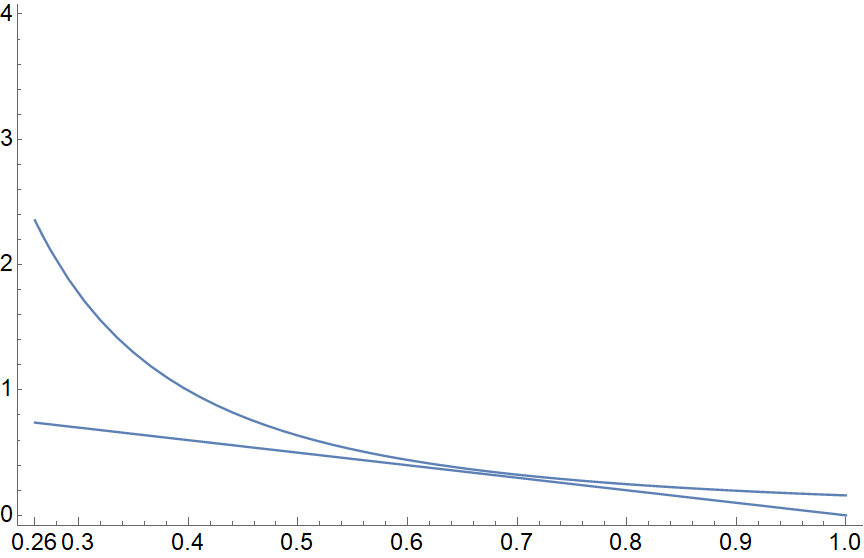
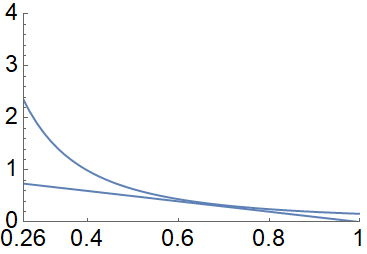
Show[Plot[1/(2 Pi x^2), {x, 0.2, 1}, PlotRange -> {{0.2, 1}, {0, 4}}], Plot[1 - x, {x, 0.2, 1}, PlotRange -> {{0.2, 1}, {0, 4}}], LabelStyle -> {16, GrayLevel[0]}, AxesOrigin -> {0.26, 0}, Axes -> True]i.sstatic.net/8eUbG.png $\endgroup$Frameis enabled,FrameTicksappear as specified.AxesOriginsimply determines the origin. You can study this solution further: i.sstatic.net/jIidi.png $\endgroup$