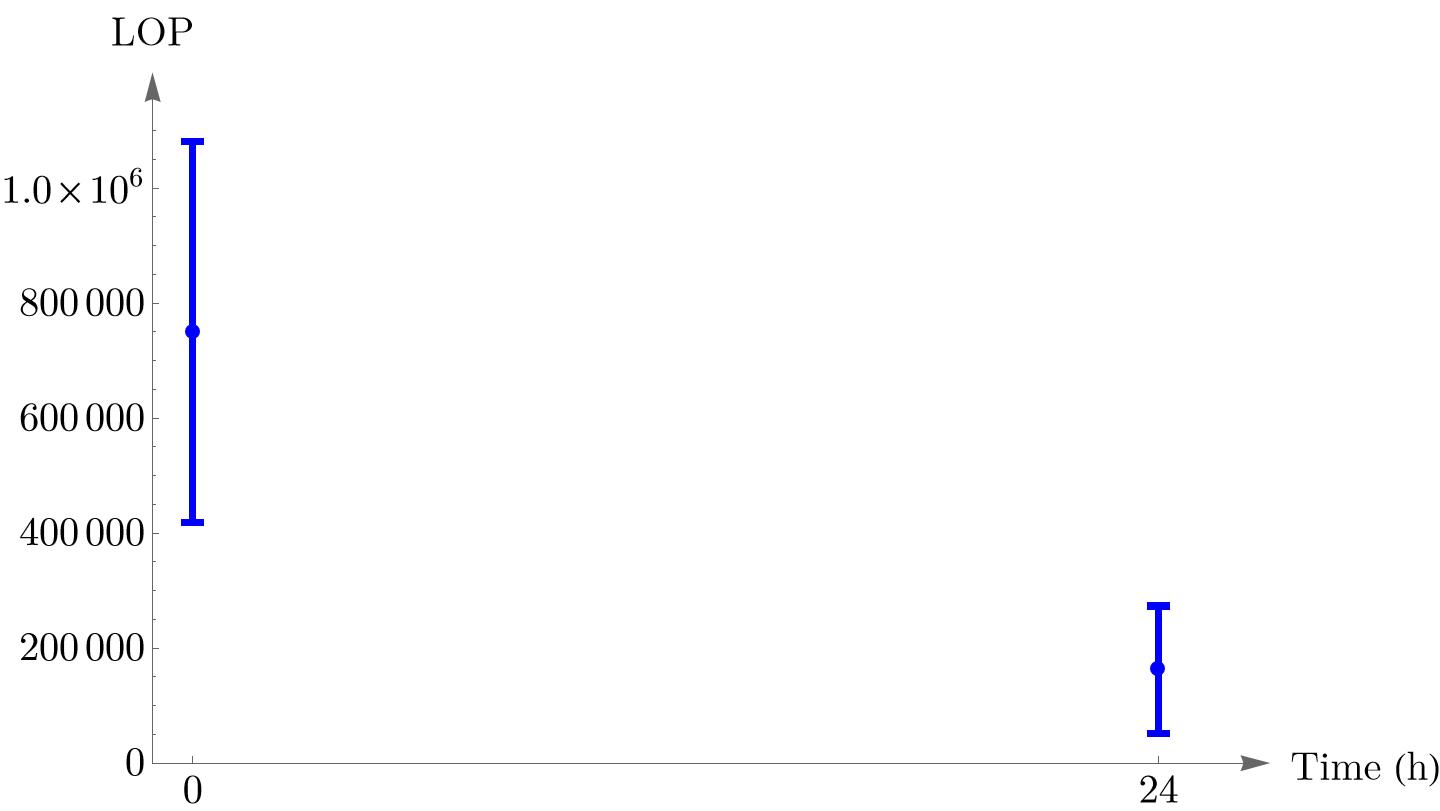
I have:
dataColinnn0 = {7*10^5, 3*10^5, 10*10^5, 10*10^5};
dataColinnn24 = {2*10^5, 0.5*10^5, 3*10^5, 1*10^5};
With the plot:
xvals = {0, 24};

dataColinnn = {#,
 Around @@
  Through[{Mean, StandardDeviation}@
    Symbol["dataColinnn" <> ToString@#]]} & /@ xvals;

 ListPlot[dataColinnn, PlotRangeClipping -> False,
 PlotRangePadding -> {{0, Scaled[0.1]}, {0, Scaled[0.1]}},
 BaseStyle -> AbsoluteThickness[3], AxesOrigin -> {-1, 0},
 Ticks -> {xvals, Automatic},
 AxesLabel -> {Style["Time (h)", FontSize -> 16,
 FontFamily -> "Latin Modern Roman 10"],
 Style["LOP", FontSize -> 16,
 FontFamily -> "Latin Modern Roman 10"]},
 AxesStyle -> Arrowheads[Medium],
 LabelStyle -> {FontFamily -> "Latin Modern Math", 16, GrayLevel[0]},
 ImageSize -> Large,
 PlotLegends ->
 Placed[{Style["Numer of parents", FontSize -> 16,
 FontFamily -> "Latin Modern Roman 10" ]}, Right], Mesh -> All,
 PlotStyle -> Blue]
My question is: How can I force the ticks on the y-axis to be shown in the scientific form?
There is a solution given in this link, but the minor ticks are disappeared.
EDIT
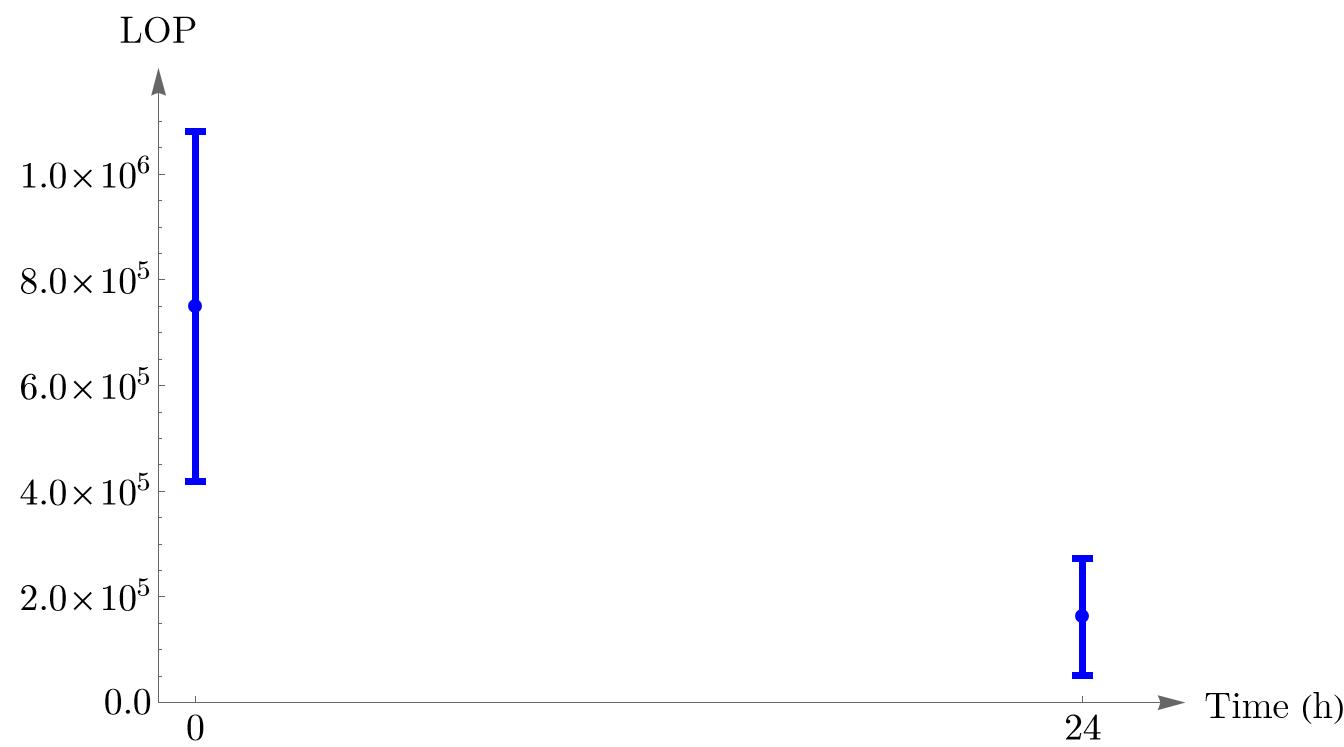
I found a solution to my comment to Jon McLoone's answer: to add NumberPoint -> ".0" to the ScientificForm in his answer:
Show[res,
AbsoluteOptions[res,
Ticks] /. {{a_Real, b_String /; b =!= "", c_List} :> {a,
ScientificForm[a, NumberPoint -> ".0"], c},
x_FormBox :> DisplayForm[x]}]
which gives:
The only problem which remains is: how to remove $0$ after decimal in the origin of vertical axis? (To make it the same as origin for the horizontal axis, i.e., simply $0$)


