3
$\begingroup$

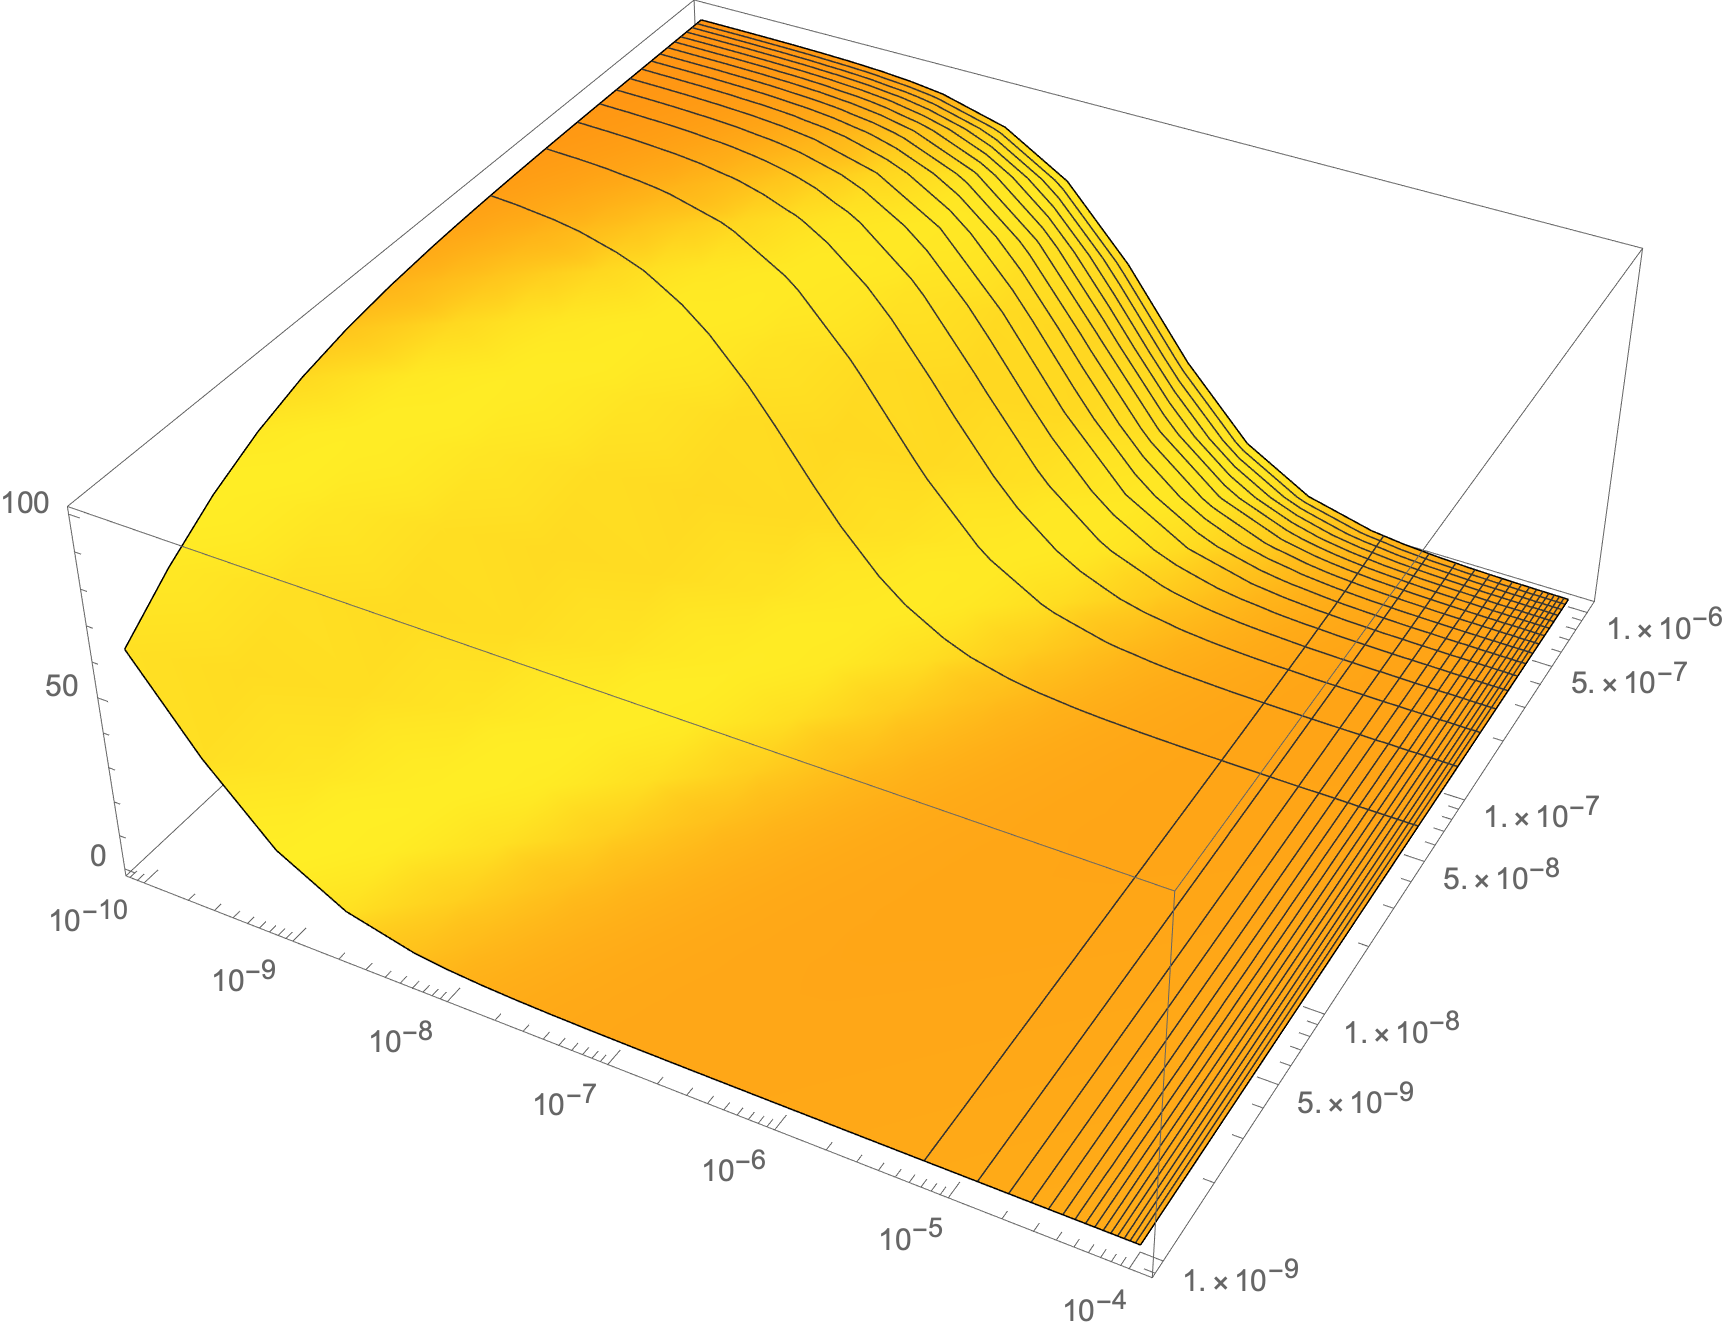
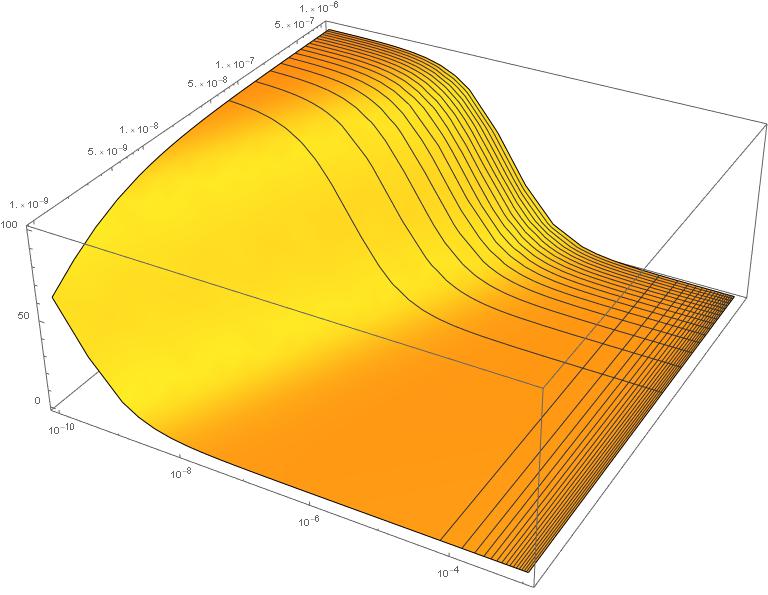
I'm generating this figure for my research:

Plot3D[(0.14 y/(x + (y - x)*0.14))*100, {x, 1/10^10, 1/10^3}, {y, 
  1/10^9, 1/10^6}, ScalingFunctions -> {"Log", "Log", None}, 
 ColorFunctionScaling -> True]

enter image description here

My question is how can I show the minor ticks on the X-axes as it shows on the Y-axes? The ticks should be in log scale. Thank you!

$\endgroup$

3 Answers 3

2
$\begingroup$
Clear["Global`*"]

f[x_, y_] = (0.14 y/(x + (y - x)*0.14))*100 // Rationalize // Simplify

(* (700 y)/(43 x + 7 y) *)

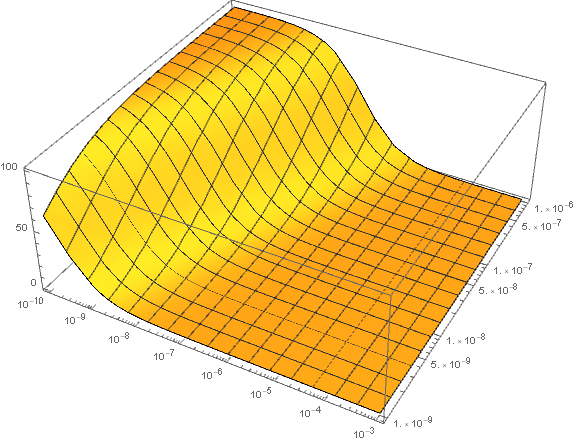
The easiest approach is to just reduce the range of x to {x, 10^-10, 10^-4}

Plot3D[f[x, y],
 {x, 10^-10, 10^-4}, {y, 10^-9, 10^-6},
 ScalingFunctions -> {"Log", "Log", None},
 ImageSize -> Large]

enter image description here

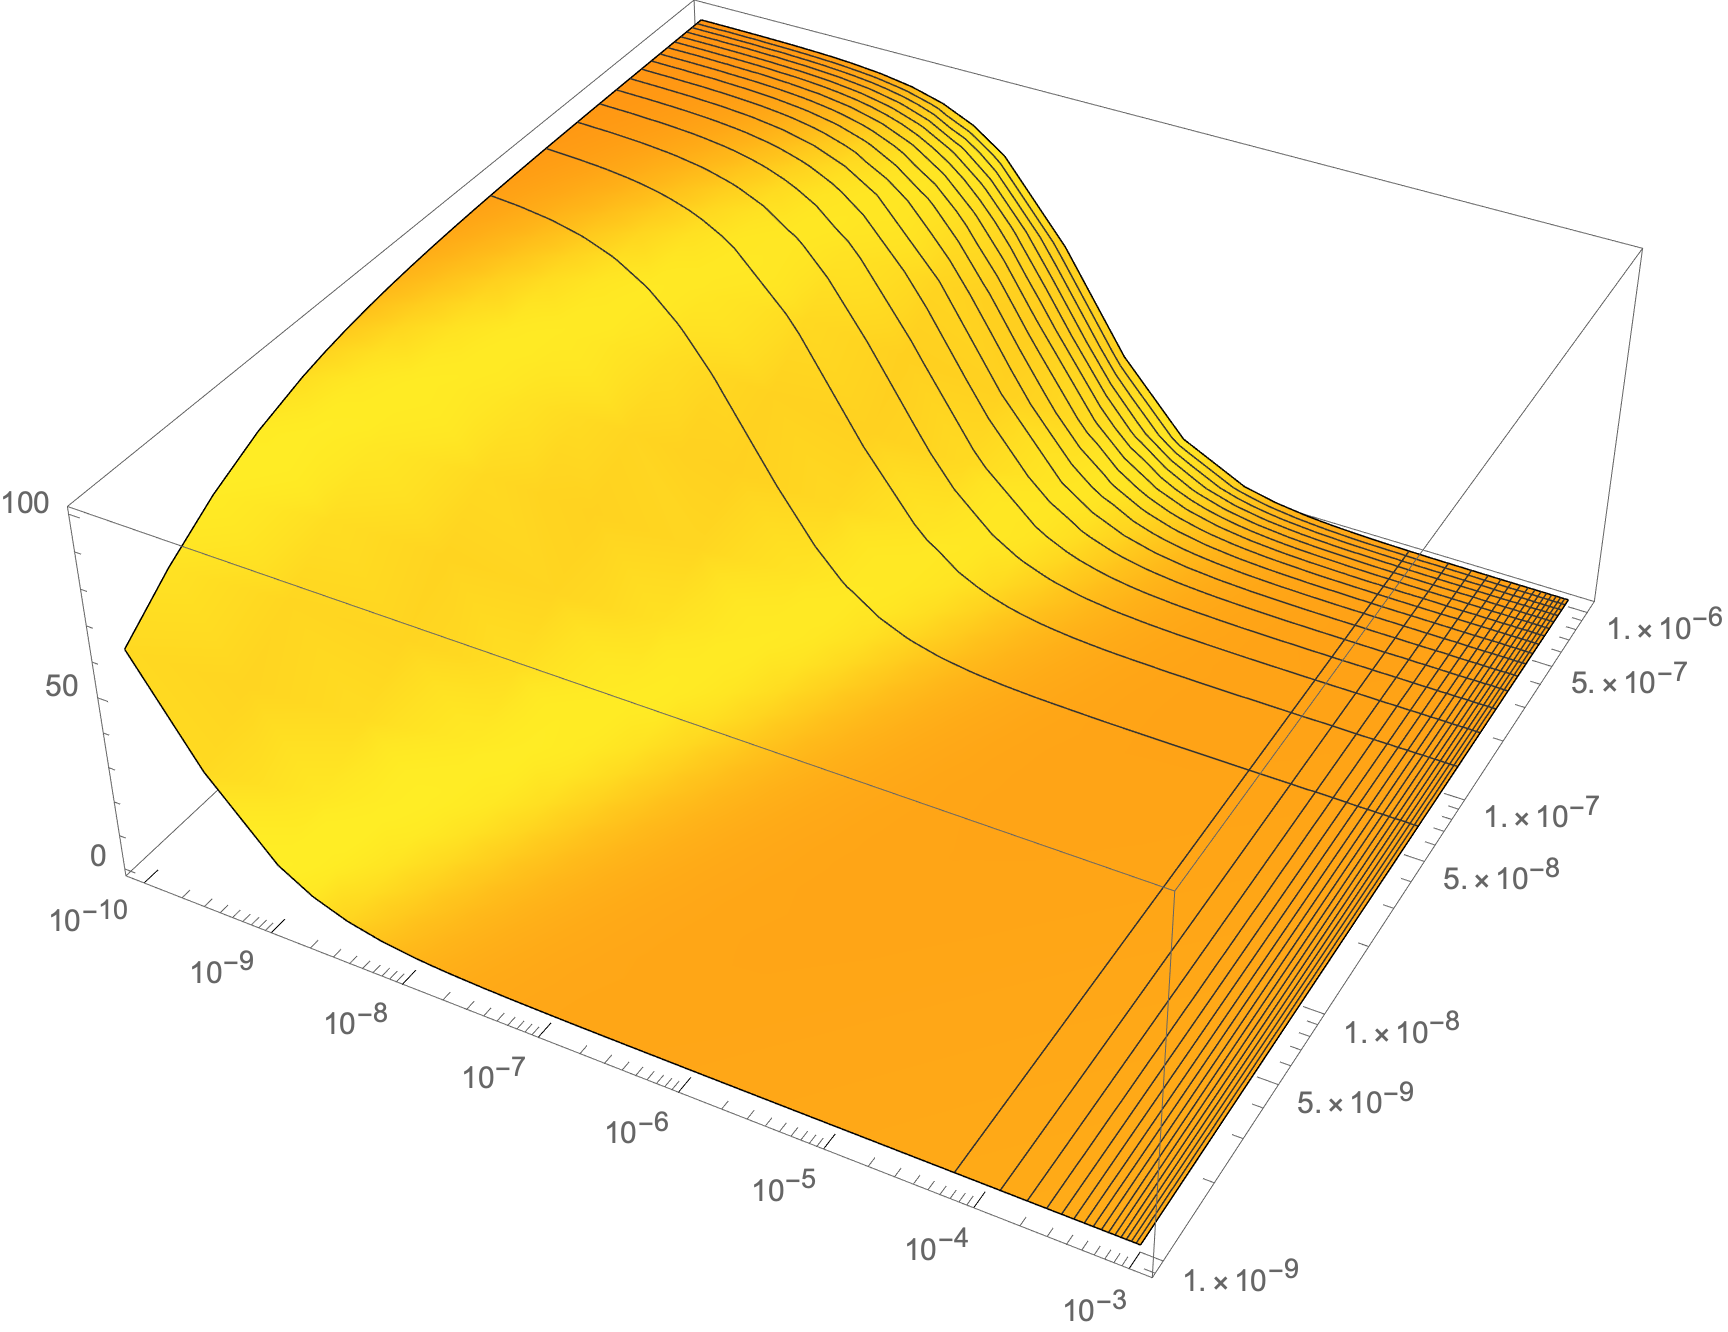
If it is essential to display the full range of {x, 10^-10, 10^-3}, manually add the ticks

xTicks = Join[
   Outer[{#1*10^#2, ""} &, Range[10], Range[-10, -3]] // 
    Flatten[#, 1] &,
   {10^#, 
      "10"^ToString[#], {0.01`, 0.`}, {GrayLevel[0.], 
       AbsoluteThickness[0.25`]}} & /@ Range[-10, -3]];

Plot3D[f[x, y],
 {x, 10^-10, 10^-3}, {y, 10^-9, 10^-6},
 ScalingFunctions -> {"Log", "Log", None},
 ImageSize -> Large,
 Ticks -> {xTicks, Automatic, Automatic}]

enter image description here

$\endgroup$
1
  • $\begingroup$ Thank you so much for the solution! I do need the original range, so I'll try the second approach. $\endgroup$ Commented Sep 6, 2020 at 1:46
1
$\begingroup$

We can fully control both the tick labels and the tick marks one each axis with the Ticks option. Your log scale could have 7 decades and 4 labels. There should be a tick mark at each mantissa from 1 to 9 and each exponent from -10 to -3. Let's define a function that gives the proper tick label and tick mark style.

The 4 labeled ticks have a mantissa m=1 and an even exponent, k, so we define

Clear[form]
form[m_, k_] := {10^k, Superscript["10", k],
   {0.02, 0.01}, Thickness[0.0025]} /; m == 1 && EvenQ[k]

In the above we use Superscript for the label, specify the length of the ticks on each side of the axis and we make the tick mark a little thicker.

The unlabeled decades have m=1 and odd exponents. We use Opacity to control the visibility of those labels like this:

form[m_, k_] := {m*10^k, 
   Style[Row[{m, Superscript[" x 10", k]}], Opacity[0.5]], 
   {0.02, 0.01}} /; m == 1 && OddQ[k]

We specify that all other tick with a transparent label, as

form[m_, k_] := {m*10^k, Style[m*10^k, Opacity[0]]}

Now we can apply this function like this

xticks = Flatten[Table[form[m, k], {k, -10, -3}, {m, 1, 9}], 1];

Plot3D[(0.14 y/(x + (y - x)*0.14))*100, 
 {x, 1/10^10, 1/10^3}, {y, 1/10^9, 1/10^6}, 
 ScalingFunctions -> {"Log", "Log", None}, 
 ColorFunctionScaling -> True,
 Mesh -> {6, 3, 1}, MeshFunctions -> {Log[#1] &, Log[#2] &},
 Ticks -> {xticks, Automatic, Automatic}]
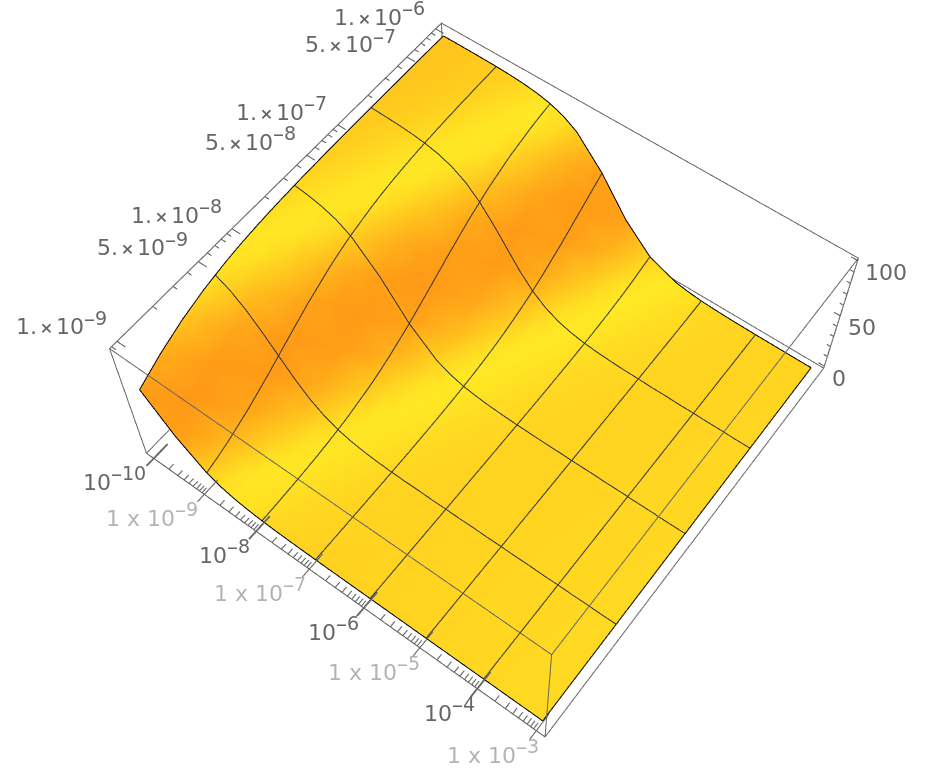
enter image description here

The Mesh and MeshFunctions options are used to align the mesh to the axis tick marks. The gray tick labels show how we could control the mantissas and exponents in the odd exponent labels if that is style we want. Or we can turn them off by changing the opacity to zero.

$\endgroup$
1
  • $\begingroup$ Thank you so much for explaining this in such detail. It helps a lot! $\endgroup$ Commented Sep 6, 2020 at 1:43
1
$\begingroup$
p3d = Plot3D[(0.14 y/(x + (y - x)*0.14))*100, {x, 1/10^10, 
    1/10^3}, {y, 1/10^9, 1/10^6}, 
   ScalingFunctions -> {"Log", "Log", None}, 
   ColorFunctionScaling -> True, ImageSize -> Large];

We can find the tick specification underlying p3d in p3d[[2]]:

Ticks /. p3d[[2]]
 {Quiet[Charting`ScaledTicks[{Log, Exp}][#1, #2, {6, 6}]] &, 
  Quiet[Charting`ScaledTicks[{Log, Exp}][#1, #2, {6, 6}]] &, Automatic}

The third argument ({6, 6}) specifies the number of major and minor ticks in the function that generates automatic ticks (Charting`ScaledTicks[{Log, Exp}]).

So we can post-process p3d to replace {6,6} with a number that gives a higher number of minor ticks:

Replace[p3d, HoldPattern[Ticks -> t_] :> Ticks -> (t /. {6, 6} -> {8, 6}), All]

enter image description here

$\endgroup$

Your Answer

By clicking “Post Your Answer”, you agree to our terms of service and acknowledge you have read our privacy policy.

Not the answer you're looking for? Browse other questions tagged or ask your own question.