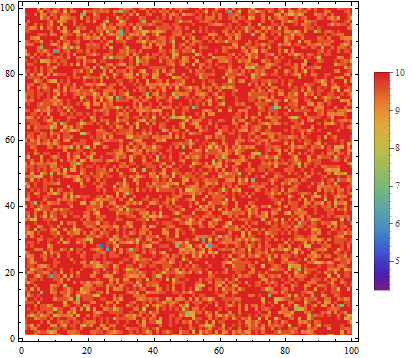
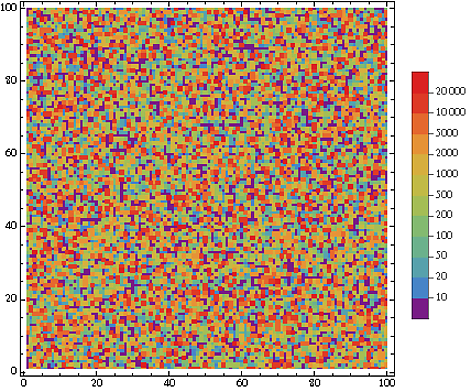
Is there a way to use a logarithmic scale in the colour legend of a ListContourPlot? The contours can be logged by taking the Log10 of the data, but this doesn't transfer to the legend. As an example, with the code:
test = Flatten[Table[{i, j, Log10[RandomReal[{0, 1*^10}]]}, {j, 1, 100}, {i, 1, 100}], 1];

ListContourPlot[test, InterpolationOrder -> 0, PlotLegends -> Automatic,
    Contours -> 20, ColorFunction -> "Rainbow", ColorFunctionScaling -> True,
    PlotRange -> All]

I get equally spaced contours for values <7, 8, 9 and 10. Could I plot these data with equally spaced contours corresponding to values 0.1, 1 and 10?
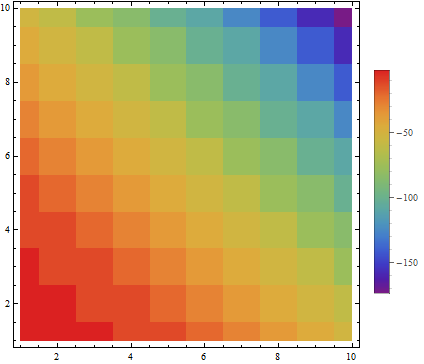
Another example, where you'd expect to see logarithmic data:
test = Flatten[Table[{i, j, Log10@Exp[-(i + j)^2]}, {j, 1, 10}, {i, 1, 10}], 1];
ListContourPlot[test, InterpolationOrder -> 0,
 PlotLegends -> Automatic, Contours -> 20, ColorFunction -> "Rainbow",
  ColorFunctionScaling -> True, PlotRange -> All]


ColorFunctions argument with that manually, I tried implementing this but got stuck here's how far I got $\endgroup$Contours$\endgroup$PlotLegends -> BarLegend[{"Rainbow", {0, 1}}, Function[{min, max}, Rescale[{.1, 1, 5, 10}, {0, 10}, {min, max}]]]? $\endgroup$