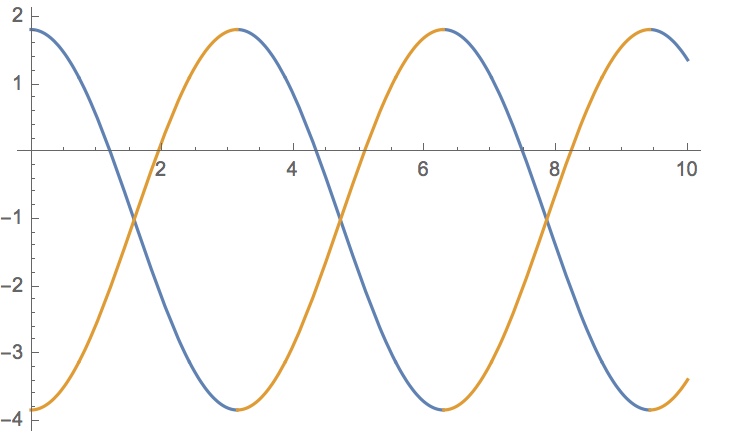
For Functions That Do Not Have Unique Values, mathematical chooses a specific value; when plotting, say, the eigenvalue of a matrix that has such branch cuts, if the eigenvalues do not cross each other, one can do a simple Sort like this one to get the correct color. However, consider this MWE:
z[t_] := Cos[t] + I*Sin[t]
Plot[{-I - Sqrt[1 - 9 z[t]^2], -I + Sqrt[1 - 9 z[t]^2]} // Im //
  Evaluate, {t, 0, T}]
the result has some discontinuities, hence different colors contrary to what one may intuitively think as a continuous curve:

For analytical functions, I can manually change/rewrite the expression so that the color does not change midway, but my problem is the eigenvalues comes from random processes where z[t] is a complex-valued random function, and Sort may not be a good solution due to possible level crossings of the eigenvalues. Is there some way to solve this problem for arbitrary complex z[t]?
Another way to think of the problem: given a set of numerical points in the figure above, is there some existing heuristic algorithm that "sort" the data into two sets that goes with what one may intuitively think? Due to the presence of the level crossing, my attempts using Sort or choosing the nearest next point may not be a good fit here.
