4
$\begingroup$

Bug introduced in 11.0 and fixed in 11.1


Given a ListPlot like this, for example:

data = RandomReal[{-1, 1}, {10, 2}];
labels = Flatten@RandomInteger[{1, 2}, {10, 1}]
ListPlot[data -> labels]

How can I style the labels with a specific color? It kind of freaks me out that it is not possible to just use Style on the labels variable like this:

data = RandomReal[{-1, 1}, {10, 2}];
labels = Style[Flatten@RandomInteger[{1, 2}, {10, 1}], Red]
ListPlot[data -> labels]

Then, no labels are shown at all.

Also, how can I increase the distance between points and corresponding labels?

I'm using mathematica: 11.0.1.0

$\endgroup$
5
  • $\begingroup$ As you've written it, the head of labels is "Style" and not "List". Try: labels = Style[#, Red] & /@ Flatten@RandomInteger[{1, 2}, {10, 1}]; $\endgroup$ Commented Aug 10, 2017 at 13:07
  • $\begingroup$ Thanks! But that doesn't work either :(. $\endgroup$
    – holistic
    Commented Aug 10, 2017 at 13:10
  • $\begingroup$ Interesting -- you seem to have different behavior than Version 11.1. How does the following work for you? labels = Style[#, Red] & /@ Flatten@RandomInteger[{1, 2}, {10, 1}]; ListPlot[ data -> labels // Thread] ? $\endgroup$ Commented Aug 10, 2017 at 13:25
  • $\begingroup$ @JohnJosephM.Carrasco: Thanks again. This version plots just black labels no matter the color, although the labels variable shows red labels now. That is very strange. I restarted mathematica, but still the same problem. $\endgroup$
    – holistic
    Commented Aug 10, 2017 at 13:31
  • $\begingroup$ Strangely, that also happens in version 10.1.0.0 on a different computer. No labels are shown $\endgroup$
    – holistic
    Commented Aug 10, 2017 at 13:39

3 Answers 3

7
$\begingroup$

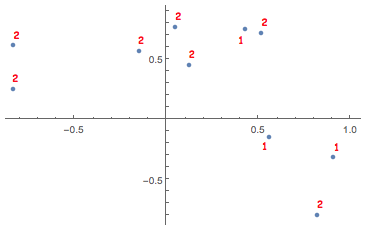
This is a bug that's been fixed in the latest version. Compare this code in versions 11.0.1 and 11.1.1

data = RandomReal[{-1, 1}, {10, 2}];
labels = Map[Style[#, Red] &]@RandomInteger[{1, 2}, 10];
$VersionNumber
ListPlot[data -> labels]

enter image description here

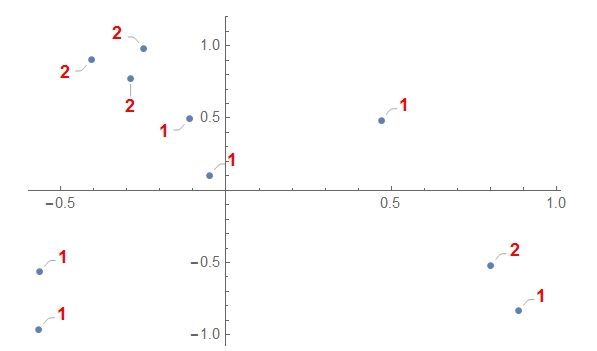
Here is a workaround for this example

myStyle := Sequence[Red, Bold, FontFamily -> "Comic Sans MS"]
ListPlot[data -> labels] /. 
 Pane[Style[label_, {}]] :> Pane[Style[label, myStyle]]

enter image description here

$\endgroup$
5
  • $\begingroup$ Thanks a lot, Jason! That works well now :) $\endgroup$
    – holistic
    Commented Aug 10, 2017 at 15:03
  • $\begingroup$ I've added the bugs tag; could you maybe add the usual header in the question for me (i.e., is the Callout[] bug also in 11.0.0)? $\endgroup$ Commented Aug 10, 2017 at 16:28
  • $\begingroup$ @J.M. - I don't have 11.0.0 or 11.1.0 installed right now so I can't verify whether this was fixed/introduced in the main or bugfix release, also not sure about the Callout bug you mention, do you have a code snippet to reproduce it? $\endgroup$
    – Jason B.
    Commented Aug 14, 2017 at 16:23
  • $\begingroup$ I meant the one in this answer, Jason: 11.1.1 shows the callouts, but 11.0.1 does not. $\endgroup$ Commented Aug 14, 2017 at 16:29
  • $\begingroup$ @J.M. - right, sorry for the confusion :-) $\endgroup$
    – Jason B.
    Commented Aug 14, 2017 at 16:51
4
$\begingroup$

Here is a bit of a monster but it works

If[
    #1 == 1, 
    Text[Style[#1, Red], #2 + {0, .05}],
    Text[Style[#1, Blue], #2 + {0, .05}]
    ] & @@@ MapThread[List, {labels, data}] // 
 Graphics[{
    #, Point @ data
    },
   Axes -> True
   ] &

This code is by no means clean nor efficient :). It only serves as a demonstration that it is possible to achieve the effect you are describing.

$\endgroup$
3
  • $\begingroup$ I am getting a bit rusty with Mathematica and don't remember the pretty way to refactor the 'If' decision block using rule syntax. Anyone feeling this could be prettified, please feel free to edit the post! $\endgroup$ Commented Aug 10, 2017 at 13:54
  • $\begingroup$ That indeed works with my version, thank you! Unfortunately, it doesn't use ListPlot, so it is a bit difficult to use the other functionalities of ListPlot :( $\endgroup$
    – holistic
    Commented Aug 10, 2017 at 14:02
  • 1
    $\begingroup$ Yeah, not fancy :P. Remember thought, all these functions do use Graphics implicitly. So, desired look and feel can be achieved by manipulating Graphics properties directly. $\endgroup$ Commented Aug 10, 2017 at 14:09
3
$\begingroup$

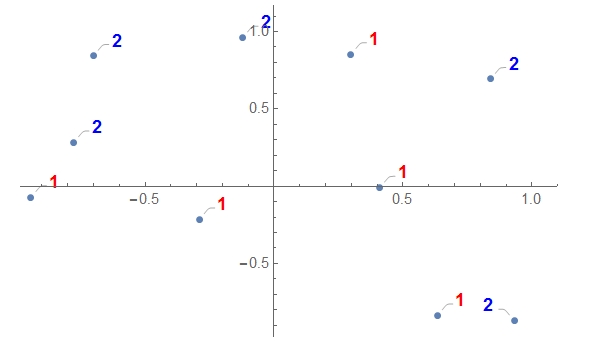
Try this:

data = RandomReal[{-1, 1}, {10, 2}];
labels = Map[Style[ToString[#], 12, Red, Bold] &, 
   Flatten@RandomInteger[{1, 2}, {10, 1}]];
ListPlot[data -> labels]

enter image description here

or this:

labels = Map[If[# == 1, Style[ToString[#], 12, Red, Bold], 
     Style[ToString[#], 12, Blue, Bold]] &,Flatten@RandomInteger[{1, 2}, {10, 1}]];
ListPlot[data -> labels]

enter image description here

Have fun!

$\endgroup$
4
  • $\begingroup$ Thanks! That is very strange. In both versions no labels are shown. I'm using mathematica 11.0.1.0, which version are you using? $\endgroup$
    – holistic
    Commented Aug 10, 2017 at 13:14
  • $\begingroup$ @holistic Well my version is 11.1.1.0 and what I get you see on the screen. But the code uses no new features and, therefore, I have no doubts that it should work also in the previous versions. In fact the same as my first version was proposed by John Joseph M. Carrasco , only written down in a slightly different way. For me it also works. $\endgroup$ Commented Aug 10, 2017 at 13:31
  • $\begingroup$ That is very strange, I just tried it on a different computer with version 10.1.0.0, same problem, no labels are shown. $\endgroup$
    – holistic
    Commented Aug 10, 2017 at 13:40
  • $\begingroup$ The above implementation uses Callout function implicitly. This function has been introduced with version 11. Therefore, the above implementation may fail for the OP. $\endgroup$ Commented Aug 10, 2017 at 13:59

Your Answer

By clicking “Post Your Answer”, you agree to our terms of service and acknowledge you have read our privacy policy.

Not the answer you're looking for? Browse other questions tagged or ask your own question.