UPDATE
As of version 11.2.0, all number formatting functions received the NHoldRest attribute:
Attributes /@ {NumberForm, ScientificForm, EngineeringForm,
  PaddedForm, AccountingForm, DecimalForm}
{{NHoldRest, Protected}, {NHoldRest, Protected}, {NHoldRest, Protected},
 {NHoldRest, Protected}, {NHoldRest, Protected}, {NHoldRest, Protected}}
The ticks range issue is also fixed:
Reap[Rasterize@
   Plot[x, {x, 0, 1},
    Ticks -> {Sow[{##}, "XTicksRange"] &, Sow[{##}, "YTicksRange"] &}], _, List][[2]]

First@AbsoluteOptions[Plot[x, {x, 0, 1}], PlotRangePadding]
{{"XTicksRange", {{-0.0208333, 1.02083}}}, {"YTicksRange", {{-0.0215054, 1.05376}}}}

PlotRangePadding -> {{Scaled[0.02], Scaled[0.02]}, {Scaled[0.05], Scaled[0.05]}}
Hence both the issues are fixed in version 11.2.0.
The NumberForm::iprf issue
It is certainly a bug introduced in version 11.0.0. This bug affects internal ticks generating function Charting`ScaledTicks which also uses NumberForm:
Charting`ScaledTicks[{Identity, Identity}][0, 1] // Take[#, 3] & // InputForm
{{0., 0, {0.01, 0.}, {AbsoluteThickness[0.1]}},
 {0.2, NumberForm[0.2, {Infinity, 1}], {0.01, 0.}, {AbsoluteThickness[0.1]}},
 {0.4, NumberForm[0.4, {Infinity, 1}], {0.01, 0.}, {AbsoluteThickness[0.1]}}}
One workaround is to convert NumberForm into string by applying ToString. But more general solution is to set NHoldRest attribute for NumberForm:
SetAttributes[NumberForm, NHoldRest]
After this change the issue disappear and the following code works without errors in Mathematica 11.0.0:
Plot[x, {x, 0, 1}, Ticks -> Charting`ScaledTicks[{Identity, Identity}]]
The ticks range issue in Mathematica 11.0.0
As to the ticks range, it is interesting to compare them in different versions of Mathematica using my Rasterize trick:
Reap[Rasterize@
   Plot[x, {x, 0, 1},
    Ticks -> {Sow[{##}, "XTicksRange"] &, Sow[{##}, "YTicksRange"] &}], _, List][[2]]
For comparison it is important to take into account the default value of PlotRangePadding which can be obtained as follows:
First@AbsoluteOptions[Plot[x, {x, 0, 1}], PlotRangePadding]
Here are outputs for different Mathematica versions (obtained on Windows 7 x64):
version 11.0.0:
{{"XTicksRange", {{0, 1.02083}}}, {"YTicksRange", {{0, 1.05556}}}}
PlotRangePadding -> {{Scaled[0.02], Scaled[0.02]}, {Scaled[0.05], Scaled[0.05]}}
versions 10.4.1 and 10.0.1:
{{"XTicksRange", {{-0.0208333, 1.02083}}}, {"YTicksRange", {{-0.0555556, 1.05556}}}}
PlotRangePadding -> {{Scaled[0.02], Scaled[0.02]}, {Scaled[0.05], Scaled[0.05]}}
version 8.0.4:
{{"XTicksRange", {{-0.0208333, 1.02083}}}, {"YTicksRange", {{-0.0208333, 1.02083}}}}
PlotRangePadding -> {Scaled[0.02], Scaled[0.02]}
Let ut play with the lower bound of the plot range:
Reap[Rasterize@
      Plot[x, {x, #, 1},
       Ticks -> {Sow[{##}, "XTicksRange"] &, Sow[{##}, "YTicksRange"] &}], _,
     List][[2]] & /@ {-10^-50, 0, 10^-2, 10^-1, .5} // Column
Here is output from version 11.0.0:
{{"XTicksRange", {{-0.0208333, 1.02083}}}, {"YTicksRange", {{0, 1.05556}
{{"XTicksRange", {{0, 1.02083}}}, {"YTicksRange", {{0, 1.05556}}}}
{{"XTicksRange", {{0, 1.02063}}}, {"YTicksRange", {{0, 1.05556}}}}
{{"XTicksRange", {{0.1, 1.01875}}}, {"YTicksRange", {{0, 1.05556}}}}
{{"XTicksRange", {{0.5, 1.01042}}}, {"YTicksRange", {{0.5, 1.02778}}}}
And here is from version 10.4.1:
{{"XTicksRange", {{-0.0208333, 1.02083}}}, {"YTicksRange", {{-0.0555556, 1.05556}}}}
{{"XTicksRange", {{-0.0208333, 1.02083}}}, {"YTicksRange", {{-0.0555556, 1.05556}}}}
{{"XTicksRange", {{-0.010625, 1.02063}}}, {"YTicksRange", {{-0.0555556, 1.05556}}}}
{{"XTicksRange", {{0.08125, 1.01875}}}, {"YTicksRange", {{-0.0555556, 1.05556}}}}
{{"XTicksRange", {{0.489583, 1.01042}}}, {"YTicksRange", {{0.472222, 1.02778}}}}
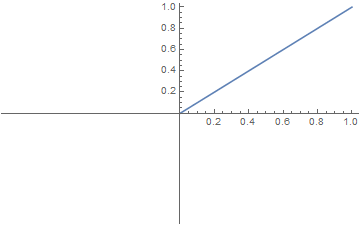
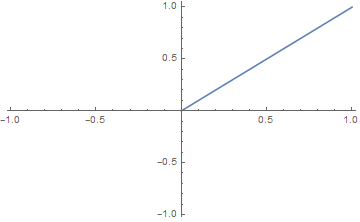
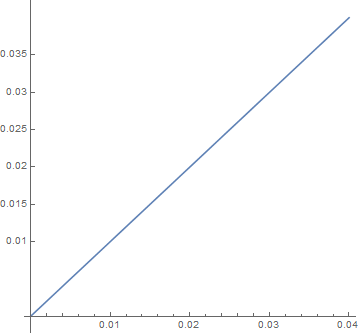
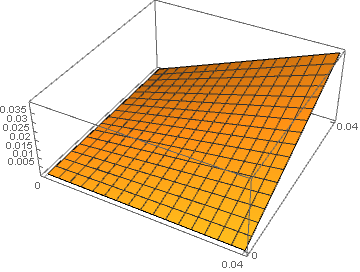
Apparently in version 11.0.0 the calculation of the lower bound of the ticks range is changed for the situations when plot range starts from nonnegative value: the corresponding Scaled PlotRangePadding setting is ignored in such situations (note that absolute PlotRangePadding works as expected!). This change introduces inconsistency and contradicts the Documentation both for Ticks and for PlotRangePadding, hence I would consider it as a bug. Here is an illustration (SetAttributes[NumberForm, NHoldRest] is for fixing the bug described in the previous section):
SetAttributes[NumberForm, NHoldRest]
Plot[x, {x, 0, 1}, Ticks -> Charting`ScaledTicks[{Identity, Identity}],
 PlotRangePadding -> {{Scaled[.5], Scaled[.02]}, {Scaled[.5], Scaled[.02]}}]

The workaround is to use absolute PlotRangePadding specification:
Plot[x, {x, 0, 1}, Ticks -> Charting`ScaledTicks[{Identity, Identity}],
 PlotRangePadding -> {{1.021, .021}, {1.021, .056}}]


