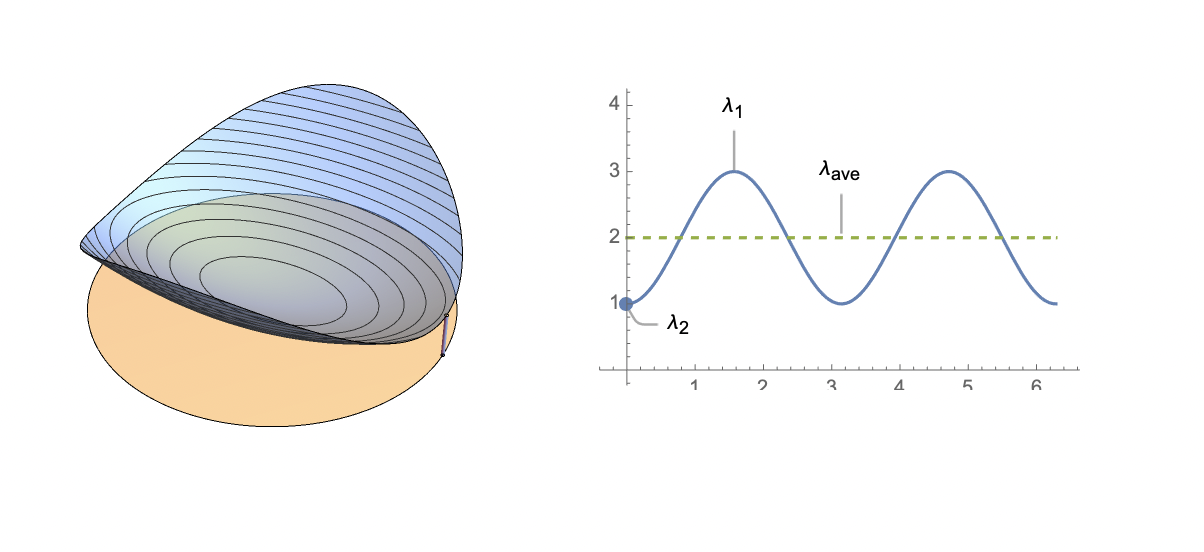
The bottom part of my axis ticks are truncated below, what is right padding option to make them show up properly?
cylinder[t_] :=
  With[{x = Cos[t], y = Sin[t]},
   Graphics3D@Cylinder[{{x, y, 0}, {x, y, x^2 + 3 y^2}}, 1/100]];
plot3da =
  Plot3D[{0, x^2 + 3 y^2}, {x, -1, 1}, {y, -1, 1},
   RegionFunction -> Function[{x, y, z}, x^2 + y^2 <= 1],
   MeshFunctions -> {#3 &}, Boxed -> False, Axes -> None,
   PlotStyle -> Opacity[0.5], PlotPoints -> 50];
plot3d[t_] := Show[plot3da, cylinder[t]]
blue = ColorData[97, "ColorList"][[1]];
plot2da =
  Plot[{Callout[Cos[t]^2 + 3 Sin[t]^2,
     "\!\(\*SubscriptBox[\(\[Lambda]\), \(1\)]\)", Above],
    Callout[Cos[t]^2 + 3 Sin[t]^2,
     "\!\(\*SubscriptBox[\(\[Lambda]\), \(2\)]\)", Below],
    Callout[2, "\!\(\*SubscriptBox[\(\[Lambda]\), \(ave\)]\)",
     Above]}, {t, 0, 2 Pi}, PlotStyle -> {blue, blue, Dashed},
   AxesOrigin -> {0, 0}];
point[t_] :=
 ListPlot[With[{x = Cos[t], y = Sin[t]}, {{t, x^2 + 3 y^2}}],
  PlotStyle -> PointSize[Large], Filling -> Axis,
  FillingStyle -> Directive[Orange, Opacity[0.8]]]
plot2d[t_] := Show[plot2da, point[t], ImageSize -> 400];
plotCombined[t_] :=
 GraphicsRow[{Show[plot3d[t], ImageSize -> 600],
   Show[plot2d[t], ImageSize -> 500]}]
plotCombined[0]


plotCombined[t_] := GraphicsRow[{Show[plot3d[t], ImageSize -> 600], Show[plot2d[t], ImageSize -> 500, PlotRangePadding -> Scaled[0.1]]}]$\endgroup$GraphicsRow[{Show[plot3d[t], ImageSize -> 600], Show[plot2d[t], ImageSize -> 500, ImagePadding->Scaled[.005]]}]? $\endgroup$