2
$\begingroup$

Recently we saw how to produce xkcd-style graphs. I evaluated the same code and deployed the result to CDF. Everything is working fine except that, in the CDF notebook, the graph is scaled according to the size of the window.

To start with, we have:
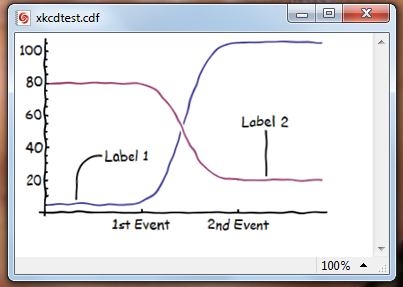
Original size

But, on resizing the window, the graphic also gets smaller:
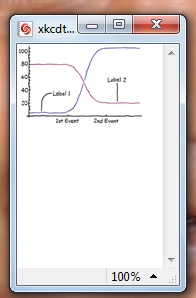
Resized window

I don't want the graph to be scaled with the window. How can I prevent this?

$\endgroup$
1
  • 3
    $\begingroup$ @subbu when your question is so badly spelled, formatted, and tagged that people cannot even tell what you are asking, then we have a problem. On this occasion I have cleaned it up, but would ask you to try harder in future. $\endgroup$ Commented Nov 27, 2012 at 16:52

1 Answer 1

7
$\begingroup$

Give explicit ImageSize option to the final Graphics function that makes your graph. Examples:

  • ImageSize -> Medium
  • ImageSize -> {550, 300}

For the excepted xkcd answer this would be here:

xkcdDistort[p_] := Module[{r, ix, iy}, r = ImagePad[Rasterize@p, 10, Padding -> White];
{ix, iy}=Table[RandomImage[{-1, 1},ImageDimensions@r]~ImageConvolve~GaussianMatrix[10],{2}];
Show[ImagePad[ImageTransformation[r, # + 15 {ImageValue[ix, #], ImageValue[iy, #]} &, 
      DataRange -> Full], -5], ImageSize -> Medium]];

Notice new Show[... , ImageSize -> Medium]

$\endgroup$
3
  • $\begingroup$ what is the final Graphics function name? $\endgroup$
    – subbu
    Commented Nov 27, 2012 at 16:37
  • $\begingroup$ @subbu see updated answer $\endgroup$ Commented Nov 27, 2012 at 16:46
  • $\begingroup$ @VitaliyKaurov >.< thanks! :D (removed stupid comment of mine) $\endgroup$
    – ssch
    Commented Nov 27, 2012 at 16:50

Your Answer

By clicking “Post Your Answer”, you agree to our terms of service and acknowledge you have read our privacy policy.

Not the answer you're looking for? Browse other questions tagged or ask your own question.