8
$\begingroup$

When making .EPS image files for publication, I tried to assemble several Graphics by Grid. For example, suppose I have:

img1 = ListLinePlot[#, ImageSize -> 500] & /@RandomReal[{0, 1}, {2, 40}];

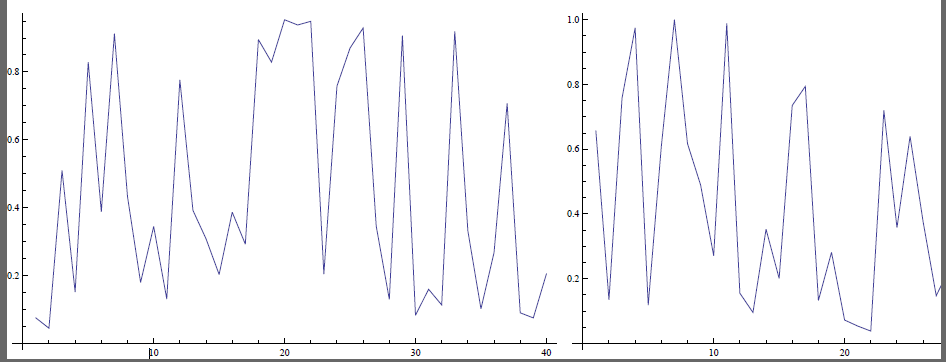
It looks like:

enter image description here

which is the result of

 Export["D:\\plapla\\eps\\test1.png", Grid[{img1}]]

So far so good, everything is fine for PNG files.

However, I need EPS (vectorgraph) rather than png (rid graphics) for publication, so I tried:

 Export["D:\\plapla\\eps\\test1.eps", Grid[{img1}]]

Unfortunately, the resulting EPS file looks like (screen shot made with Snipping Tool -- ignore the gray backgroud):

enter image description here

You can see that the right part of image was lost after in the EPS file. The image is "too big" and spreads beyond the bounds and gets cut. I really need these damn EPS files. So how can I fix this problem?

-----------------------------I'm parting line---------------------------------

@george2079 's answer works perfectly except that there's a manual operation(add a line of ".8 dup scale" after "%%EndComments" in eps file by Notepad++).

@Jens 's answer has the advantage of automation and it's fine for the example above, however, it'll change the ratio between the sizes of frameticks and image. for example consider(noticed the FrameTicksStyle and LabelStyle):

img1 = ListLinePlot[#, Frame -> True, LabelStyle -> 20, 
FrameLabel -> {"x", "y"}, FrameTicksStyle -> 20, 
ImageSize -> 400] & /@ RandomReal[{0, 1}, {4, 40}]

it looks fine in notebook. Export to eps by:

Export["D:\\plapla\\eps\\test-4.eps", 
Graphics[{Inset[GraphicsGrid[{img1}], {0, 0}, {Left, Bottom}, 1]}, 
ImageSize -> 500, PlotRange -> {{0, 1}, {0, 1}}]]

the EPS(after converted by evil Adobe Acrobat Pro) looks like:

enter image description here

It's a said story.too large label and ticks. the image size changes with s in Graphics[{Inset[___]}, ImageSize -> s,___], but the size of label and frameticks remains the same. the fine-tuned ratio between the sizes of frameticks and image was lost...

$\endgroup$
3
  • $\begingroup$ Instead of imposing an explicit numerical ImageSize, try ImageSize -> Full in your ListPlot. This should force the size of the plots to adapt so they fill the Grid elements without overrun. $\endgroup$
    – MarcoB
    Commented Jul 29, 2015 at 14:24
  • $\begingroup$ @MarcoB In fact I have to use explicit numerical ImageSize in ListPlot to adjust my plot image size and lable/frameticks size(because the size of lable/frameticks will not change with ImageSize) $\endgroup$
    – Harry
    Commented Jul 29, 2015 at 14:36
  • 1
    $\begingroup$ Harry, as George has mentioned in his answer, the truncation seems to come from whatever program you used to look at the EPS, but the EPS itself is fine. In fact, I tried opening the EPS generated by your expression in GIMP, and this was the result: i.imgur.com/0aG9rMY.gif which looks fine; instead, converting the EPS to PDF with Adobe Acrobat Pro of all things resulted in a truncated image! $\endgroup$
    – MarcoB
    Commented Jul 29, 2015 at 15:45

3 Answers 3

8
$\begingroup$

so you understand whats happening, the image is all there and being cut off by whatever software you use to render because it is wider than the page.

It may actually be ok if you use some other software that properly handles eps. Acrobat cuts it off which is really annoying since they literally wrote the standard, but just for example, it imports correctly into MS Office.

One fix, if its a one-off is to manually edit the eps file, so the first few lines look like this:

%!PS-Adobe-3.0 EPSF-1.2
%%BoundingBox: 0 0 582 184
%%HiResBoundingBox: 0 0 582 184
...
%%EndComments
.8 dup scale

Note the bounding box values are scaled by 0.8 and rounded up to integers. The .8 factor comes from ensuring the size is less than roughly 612x792.

$\endgroup$
1
  • $\begingroup$ could the factor 0.8 be calculated automatically? I mean for example 0.8=612/size of original eps(how to get it?) $\endgroup$
    – Harry
    Commented Jul 30, 2015 at 3:32
7
$\begingroup$

Here is how you can get exact control over the exported page size directly from Mathematica:

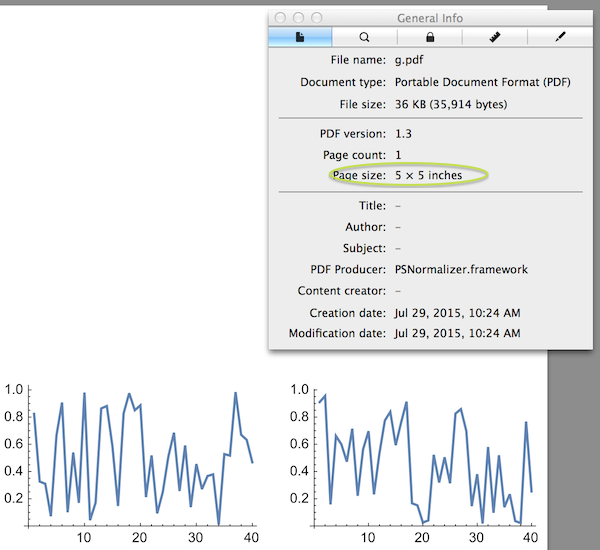
I'll assume I want exactly a 5 inch square page. Then I would create a GraphicsGrid instead of Grid from the plots, and output them in an Inset with a Graphics wrapper that has exactly 5 inches as its ImageSize:

img1 = 
  ListLinePlot[#, ImageSize -> 500] & /@ RandomReal[{0, 1}, {2, 40}];

g = 
 Graphics[{Inset[GraphicsGrid[{img1}], {0, 0}, {Left, Bottom}, 1]}, 
  ImageSize -> 5*72, PlotRange -> {{0, 1}, {0, 1}}]

Export["g.eps", g]

(* ==> "g.eps" *)

eps

The screen shot shows that the dimensions are produced correctly. In ImageSize -> 5*72, I used the fact that there are 72 points in an inch (so the conversion factor from inches to ImageSize is 72).

To make the plot page non-square, you would use something like ImageSize -> {5*72, 4*72} for a 5 by 4 inch rectangle. A better approach is probably to set an ImageSize only for the horizontal axis and specify a value for the AspectRatio of the wrapper Graphics, e.g., , AspectRatio -> .4.

Another possible use of this approach is to rotate the output by applying the rotation directly to the Inset. That way you may get a better fit to the desired page dimensions.

$\endgroup$
4
  • 1
    $\begingroup$ There are 72 printer's points in an inch (at least for the current most commonly accepted size of a printer's point). Not pixels! $\endgroup$ Commented Jul 29, 2015 at 17:43
  • $\begingroup$ note you need to get the aspect ratio of ImageSize just right or you will end up with a bunch of extra white space when you import with software that properly respects the bounding box. $\endgroup$
    – george2079
    Commented Jul 29, 2015 at 17:44
  • $\begingroup$ @OleksandrR. You're right, I'll correct the terminology. Anyway, I meant the unit used by ImageSize, and that is in fact "points." $\endgroup$
    – Jens
    Commented Jul 29, 2015 at 17:47
  • $\begingroup$ @george2079 That's true - I added a comment about how to set AspectRatio which may be better than setting a vertical dimension. $\endgroup$
    – Jens
    Commented Jul 29, 2015 at 17:56
4
$\begingroup$

One non-perfect workaround is to Magnify your graphics in order to fit the page width:

Export["test1.eps", Magnify[Grid[{img1}], .8]]

But perfect result can be achieved by Exporting to PDF and then converting PDF to EPS using a third-party tool like free pdftops utility which is a part of Poppler (you can download Windows binaries here):

Export["test1.pdf", Grid[{img1}]]

Then in the command-prompt:

pdftops -eps test1.pdf testoutput.eps

Here is how "testoutput.eps" looks when is opened by Adobe Acrobat:

screenshot

The process can be completely automatized, see an example here.

$\endgroup$

Your Answer

By clicking “Post Your Answer”, you agree to our terms of service and acknowledge you have read our privacy policy.

Not the answer you're looking for? Browse other questions tagged or ask your own question.