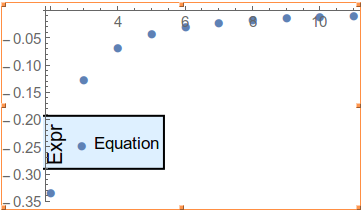
I have been trying to export an image (not the image below) with a legend to a pdf format for a publication (Mathematica 11.0.1). Unfortunately everything I have tried exports a version of the graphic where the legend is moved somewhere. I have tried looking into this (Szabolcs answer), this and have looked at the discussion here, but can't get it to work.
Here is a minimal example
data = Table[1/(1 - x^2), {x, 2, 11, 1}];
points = Table[x, {x, 2, 11, 1}];
pp = ListPlot[Transpose[{points, data}], PlotMarkers -> Automatic,
  PlotLegends ->
   Placed[PointLegend[{"Equation"},
     LegendFunction -> (Framed[#, Background -> LightBlue,
         FrameStyle -> Directive[Black, Thick]] &),
     LegendMarkerSize -> 12,
     LegendLabel ->
      Placed["Expr", Left, Rotate[Style[#, 14], 90 Degree] &],
     LabelStyle -> Directive[12], LegendMargins -> 0], {0.19, 0.3}]]
Exporting it with
Export["SomeDestination.pdf", pp, ImageResolution -> 600]
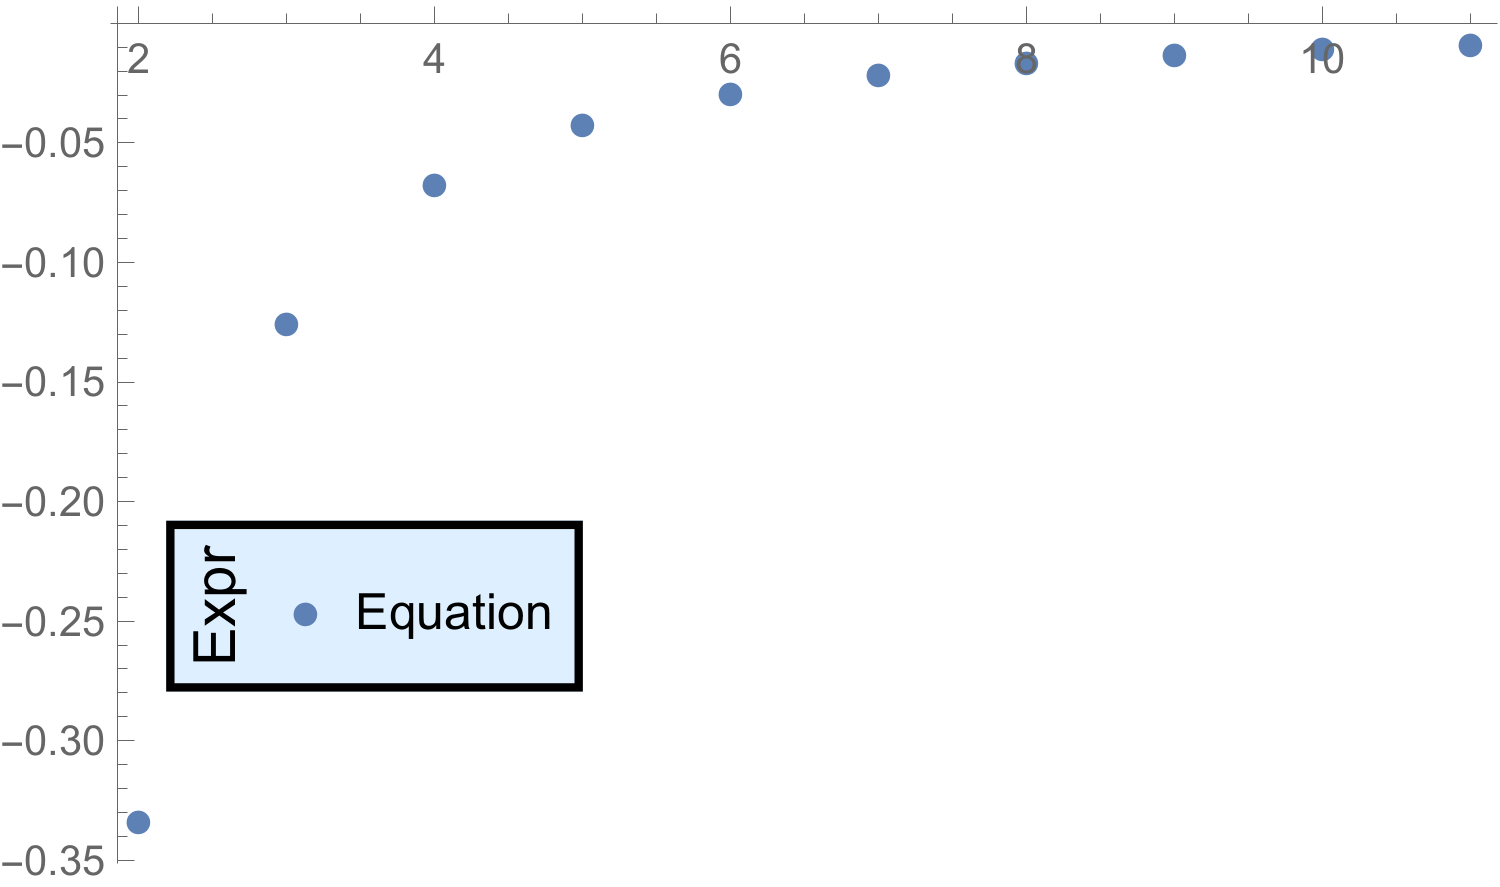
Leads to
(This is also the result of right-clicking on the graph in the notebook (the first provided image here) and selecting "Save Graphic as")
I have also tried doing
cm = 72/2.54;
image = Rasterize[Show[pp, ImageSize -> 126/10 cm], "Image",
   ImageResolution -> 600];
Export["SomeDestination.pdf",
 Show[image, ImageSize -> 126/10 cm], ImageResolution -> 600]
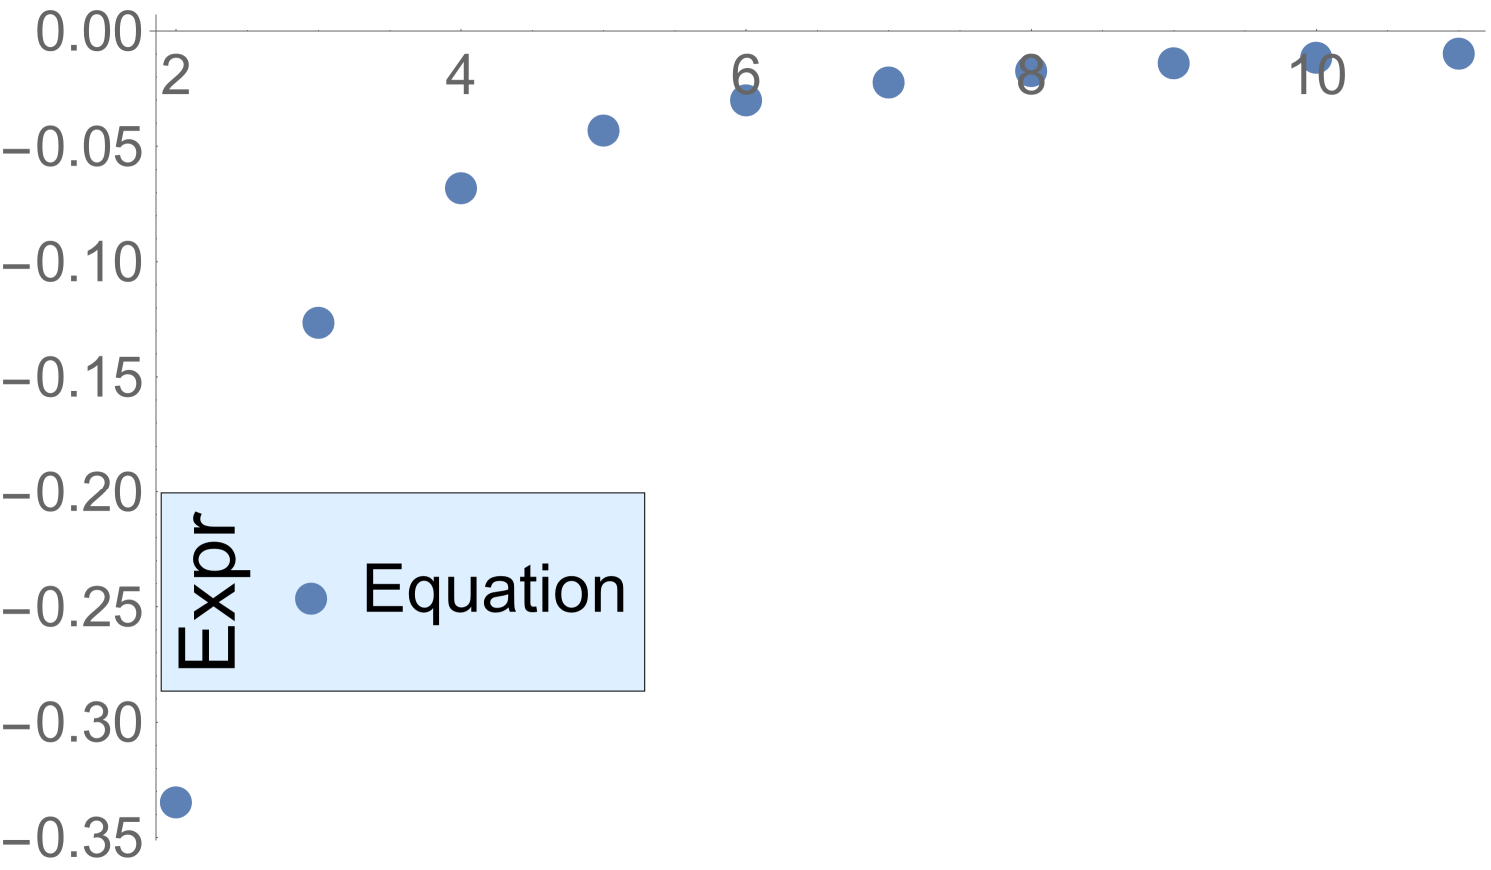
which gives
So we have three different images.
This is all done under
In[38]:= Options[$FrontEnd, {PrintingStyleEnvironment,
  ScreenStyleEnvironment}]

Out[38]= {PrintingStyleEnvironment -> "Working",
 ScreenStyleEnvironment -> "Working"}
All I want is to export as a pdf what I see in the notebook.
P.S. I would also be happy to see a solution where the image is not exported to a pdf, but to any other format.


Save Graphic As...menu. That allows you to save asPDFin the most faithful way. $\endgroup$Export. I also updated my question to include that information $\endgroup$ImageSizein your originalListPlot? $\endgroup$ImageSizeandImageResolutionare two different things, aren't they? The former will just make the image bigger (more pixels), but the density of points on the plot will be the same, whereas the latter increases the dpi (dots per inch), while keeping the pixel size, hence making a sharper image. I need a very high quality plot (600 dpi or higher by requirements), but not a big plot $\endgroup$