1
$\begingroup$

I have to plot this function:

Q[ω_] := ArcTan[1/ω]/(1 + 1/2*Log[(1 + ω^2)/ω^2])

And I did it through

Plot[Q[ω], {ω, 0, 3},
  PlotRange -> {0, 1}, 
  PlotStyle -> {Black}]

In a very simple way.

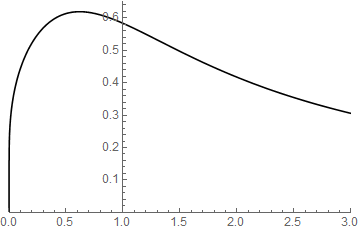
The output is the following:

enter image description here

But here is the problem: the function, as $\omega \to 0$ must be zero.

Why the plot doesn't show that behaviour?

The convergence to zero is really slow (to say: for $\omega \to 10^{-309}$ I just obtained $0.0022$). Is there a way to make the plot to start from zero?

$\endgroup$

2 Answers 2

2
$\begingroup$

The plot is showing this behavior. Change the PlotRange to see it more clearly.

Plot[Q[ω], {ω, 0, 3}, 
 PlotRange -> {{0, 0.05}, Automatic}, PlotStyle -> {Black}]

Better still is to check the limit of the function as ω -> 0

In[6]:= Limit[Q[ω], ω -> 0]

Out[6]= 0
$\endgroup$
4
  • $\begingroup$ Ah, teak you! I suspected it was because of the very slow convergence to zero... Here it is! Thank you so much! $\endgroup$
    – Enrico M.
    Commented May 17, 2017 at 9:43
  • $\begingroup$ I don't think this solves the problem. I guess one can do it with appropriate reparametrization and plotting the graph with PolarPlot. $\endgroup$
    – Artes
    Commented May 17, 2017 at 10:11
  • $\begingroup$ @Artes Actually it did. $\endgroup$
    – Enrico M.
    Commented May 17, 2017 at 12:02
  • 1
    $\begingroup$ @HenryTuring The problem was to make an appropriate plot, when I draw it with PlotRange -> {{0, 0.05}, Automatic} values of Q start roughly from 0.1, and when I take PlotRange -> {{0, 0.001}, Automatic} I encounter the same issue, i.e. it does not start from {0, 0}. $\endgroup$
    – Artes
    Commented May 17, 2017 at 12:11
1
$\begingroup$

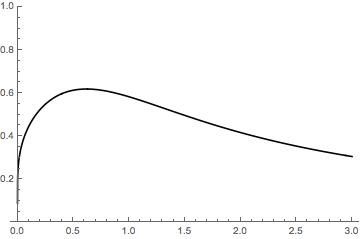
If you plot slightly into the negative then limit the PlotRange to positive values you get this:

Plot[Q[ω], {ω, -0.01, 3}
 , PlotRange -> {{0, 3}, {0, Full}}
 , PlotStyle -> {Black}
 , AxesOrigin -> {1, 0}
]

enter image description here

$\endgroup$
3
  • $\begingroup$ No need to go negative; PlotRange -> {Automatic, {0, Full}} actually suffices: Plot[Q[ω], {ω, 0, 3}, AxesStyle -> Opacity[1/2], PlotRange -> {Automatic, {0, Full}}, PlotStyle -> {Black}] $\endgroup$ Commented May 17, 2017 at 12:31
  • $\begingroup$ @J.M. In version 10.1.0 under Windows I do in fact need to, and with your code the line doesn't make it all the way to zero. $\endgroup$
    – Mr.Wizard
    Commented May 17, 2017 at 12:33
  • $\begingroup$ Huh. I guess it's something they did in 11, then... $\endgroup$ Commented May 17, 2017 at 12:38

Your Answer

By clicking “Post Your Answer”, you agree to our terms of service and acknowledge you have read our privacy policy.

Not the answer you're looking for? Browse other questions tagged or ask your own question.