deleted 42 characters in body
Source Link
Mr.Wizard
  • 273.1k
  • 34
  • 595
  • 1.4k

I have to plot this function:

Q[\[Omega]_]Q[ω_] := 
 ArcTan[1/\[Omega]]ω]/(1 + 1/2*Log[(1 + \[Omega]^2ω^2)/\[Omega]^2]ω^2])

And I did it through

Plot[Q[\[Omega]]Plot[Q[ω], {\[Omega]ω, 0, 3},
  PlotRange -> {0, 1}, 
  PlotStyle -> {Black}]

In a very simple way.

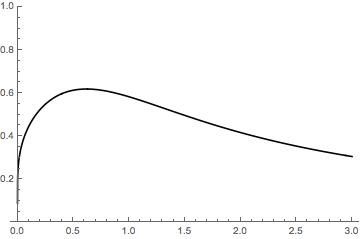
The output is the following:

enter image description here

But here is the problem: the function, as $\omega \to 0$ must be zero.

Why the plot doesn't show that behaviour?

The convergence to zero is really slow (to say: for $\omega \to 10^{-309}$ I just obtained $0.0022$). Is there a way to make the plot to start from zero?

I have to plot this function:

Q[\[Omega]_] := 
 ArcTan[1/\[Omega]]/(1 + 1/2*Log[(1 + \[Omega]^2)/\[Omega]^2])

And I did it through

Plot[Q[\[Omega]], {\[Omega], 0, 3}, PlotRange -> {0, 1}, 
PlotStyle -> {Black}]

In a very simple way.

The output is the following:

enter image description here

But here is the problem: the function, as $\omega \to 0$ must be zero.

Why the plot doesn't show that behaviour?

The convergence to zero is really slow (to say: for $\omega \to 10^{-309}$ I just obtained $0.0022$). Is there a way to make the plot to start from zero?

I have to plot this function:

Q[ω_] := ArcTan[1/ω]/(1 + 1/2*Log[(1 + ω^2)/ω^2])

And I did it through

Plot[Q[ω], {ω, 0, 3},
  PlotRange -> {0, 1}, 
  PlotStyle -> {Black}]

In a very simple way.

The output is the following:

enter image description here

But here is the problem: the function, as $\omega \to 0$ must be zero.

Why the plot doesn't show that behaviour?

The convergence to zero is really slow (to say: for $\omega \to 10^{-309}$ I just obtained $0.0022$). Is there a way to make the plot to start from zero?

Source Link
Enrico M.
  • 963
  • 1
  • 7
  • 16

Plot issue and numerical disagreement

I have to plot this function:

Q[\[Omega]_] := 
ArcTan[1/\[Omega]]/(1 + 1/2*Log[(1 + \[Omega]^2)/\[Omega]^2])

And I did it through

Plot[Q[\[Omega]], {\[Omega], 0, 3}, PlotRange -> {0, 1}, 
PlotStyle -> {Black}]

In a very simple way.

The output is the following:

enter image description here

But here is the problem: the function, as $\omega \to 0$ must be zero.

Why the plot doesn't show that behaviour?

The convergence to zero is really slow (to say: for $\omega \to 10^{-309}$ I just obtained $0.0022$). Is there a way to make the plot to start from zero?