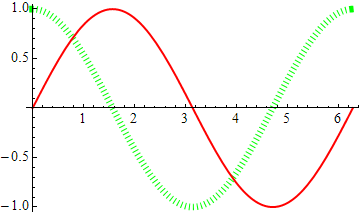
EDIT: I posed this as a version issue but now I think it's (also?) an OS issue. Problem exists on both v10.1 and v11.0 on macOS Sierra, but does not exist on Mr.Wizard's post which is v10.1 (OS unknown), though Mr.Wizard claims to now have the issue as well.
While reading this post and the answer by Mr.Wizard I noticed a difference in plotting behavior between his version and mine that made me unable to reproduce his plot. The meaning of Thickness seems in his case to be the lateral thickness of a line (preserving e.g. Dashing), but in my case to be the omnidirectional thickness of each visual bit of a line (destroying e.g. Dashing).
The code in question (see our exchange in the comments on his answer):
Plot[{Cos[x], Sin[x]}, {x, 0, 2 Pi}, PlotStyle -> {{Green, Thickness[.02], Dashing[Tiny]}, {Red, Thickness[Large]}}]
Which in v.10.1 on Windows produced this:
but in any version on macOS Sierra produces this:
He also pointed out that using Directive does not change behavior on either version, i.e.
Plot[{Cos[x], Sin[x]}, {x, 0, 2 Pi}, PlotStyle -> {Directive[Green, Thickness[.02], Dashing[Tiny]], Red}]
does not fix the problem.
So question: Is there a workaround for this? And is this really a bug or am I misunderstanding a new "feature"?


CapForm["Butt"]. $\endgroup$