This is a bug in 10.4. One-dimensional regions embedded in the plane will not be plotted by RegionPlot. For example,
RegionPlot[ImplicitRegion[x^2 + y^2 == 1, {x, y}]]
renders as an empty. In 10.3 and in 11.0.1, it can be plotted without problems.
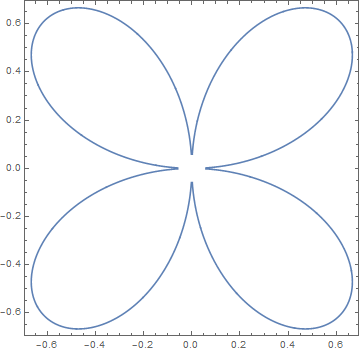
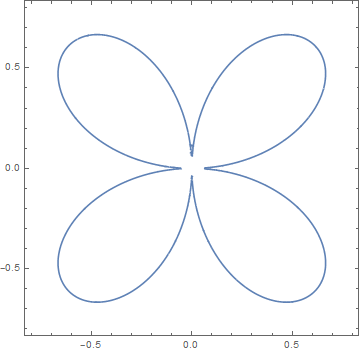
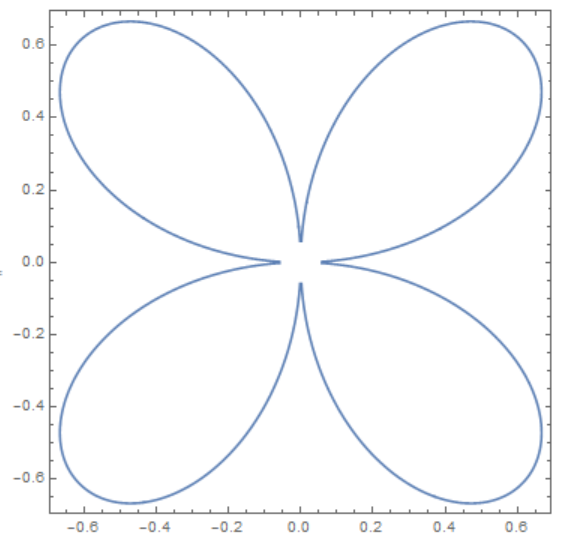
However, the specific region you show has another problem, present even in 10.3 and 11.0. Only part of the region is shown:
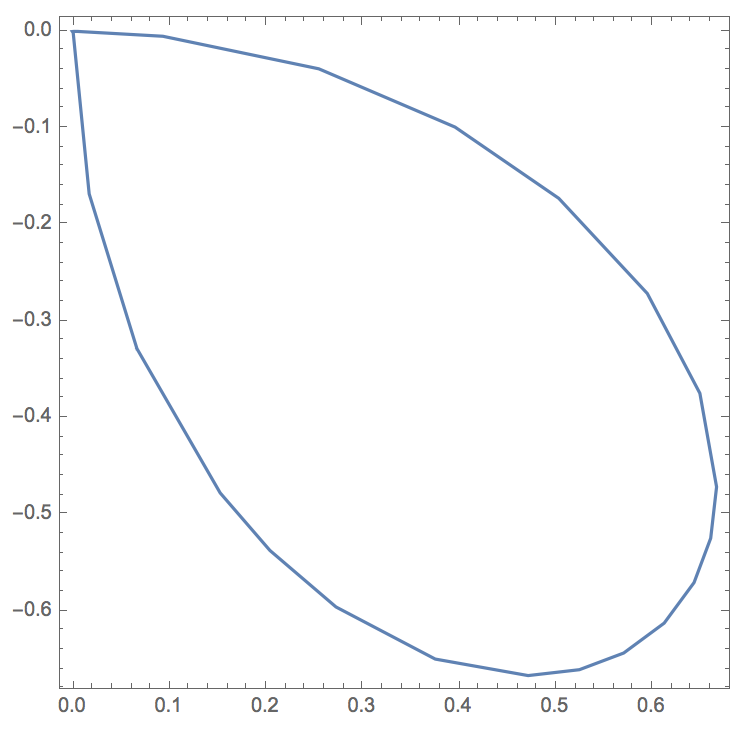
A good workaround for 10.3 is to manually specify the boundaries. Well, we can do it semi-automatically using RegionBounds.
RegionPlot[r, PlotRange -> RegionBounds[r]]
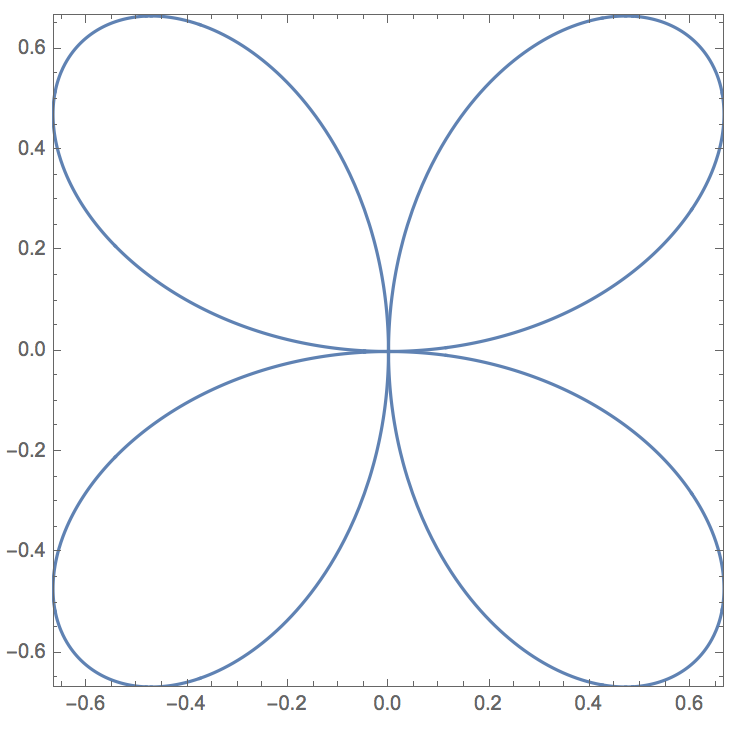
Unfortunately, specifying the PlotRange in 11.0 causes a hang.
As you can see, there are at least 3 seemingly distinct bugs here, which affect different versions:
10.4 won't plot 1D regions embedded in 2D. 10.0-10.3 and 11.0 do not suffer from this.
10.0-11.0 will only plot a quarter of this specific region unless the PlotRange is manually specified. Also discussed in: Cannot reproduce TransformedRegion example shown in documentation
10.4 and 11.0 hang if the PlotRange is manually specified for this region. This problem is not present in 10.0-10.3.
Note: I have not actually tested 10.1 and 10.2. I assumed that when 10.0 and 10.3 behave identically, so do any versions in-between.

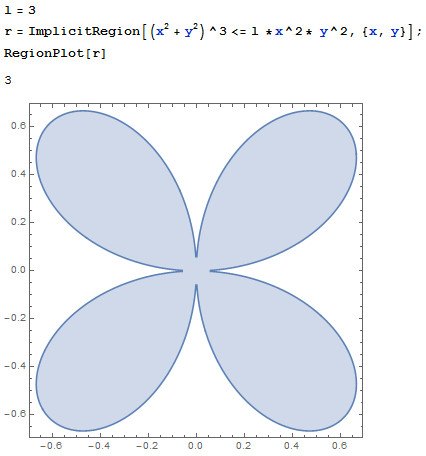


10.4.1 for Linux x86 (64-bit): no 2D examples from the docs give a plot. Not evenRegionPlot[ImplicitRegion[x^2 + y^2 == 1, {x, y}]]. $\endgroup$RegionPlotplots only one petal. It seems the bug is fixed only partially... $\endgroup$