9
$\begingroup$

Bug introduced in 10.0.2 or earlier and fixed in 11.1.0
Note: TransformedRegion was introduced in 10.0.0.


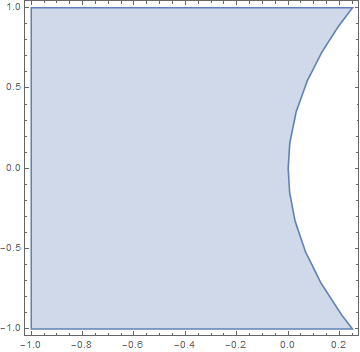
Reproducing an example from Mathematica's help, I obtain an incomplete plot

ClearAll; a = TransformedRegion[Disk[{1, 1}, 4], {Indexed[#, 1] *Indexed[#, 2], 
Indexed[#, 1] + Indexed[#, 2]} &];RegionPlot[a]

enter image description here

instead of an entire plot. How to fix it?

$\endgroup$
7
  • $\begingroup$ "ClearAll;" doesn't do anything. I've seen people using this more than once in the past week on this site, and I don't know where it is coming from. You need to actually call the function, and give it an argument. ClearAll["Global`*"]. $\endgroup$
    – Szabolcs
    Commented Oct 28, 2016 at 6:44
  • $\begingroup$ @Szabolcs : Thank you. I will follow your advice. $\endgroup$
    – user64494
    Commented Oct 28, 2016 at 6:50
  • $\begingroup$ It doesn't work in any of 10.0, 10.3.1, 10.4.1, 11.0.1. Very strange. I wonder if there is any version in which it works since this was introduced in 10.0 ... You should report this to Wolfram Support. DiscreteizeRegion works fine. $\endgroup$
    – Szabolcs
    Commented Oct 28, 2016 at 6:50
  • $\begingroup$ @Szabolcs : I tried to submit it, but could not attach a *.nb file with the executed code. Because of this reason I asked the question. $\endgroup$
    – user64494
    Commented Oct 28, 2016 at 6:53
  • $\begingroup$ Why not? Did you try here? If the web form doesn't work, use the email address: support at wolfram.com. $\endgroup$
    – Szabolcs
    Commented Oct 28, 2016 at 6:54

1 Answer 1

8
$\begingroup$

I am not sure if others (or Wolfram Support) would agree, but this seems like a bug to me. I'll leave tagging as to others. Please do report it to Wolfram Support though.

I get the same result that you show in all of 10.0.2, 10.3.1, 10.4.1 and 11.0.1. This is surprising because the functionality was introduced in 10.0, so I wonder if there is any released version at all in which this works correctly.

Luckily the workaround is easy. Just set the PlotRange manually. The correct value can be determined using RegionBounds. This is another reason why it feels suspiciously like a bug that this is not done automatically with PlotRange set to Full, All or Automatic.

RegionPlot[a, PlotRange -> RegionBounds[a], 
 PlotRangePadding -> Scaled[.05]]
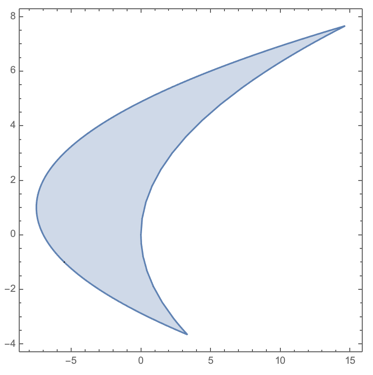
enter image description here

I used PlotRangePadding simply to leave some extra space around the edges.

An alternative is using DiscretizeRegion.

DiscretizeRegion[a]

DiscretizeRegion::drc: Available methods not able to resolve all components of dimension less than the embedding dimension 2; these may be omitted from the result.
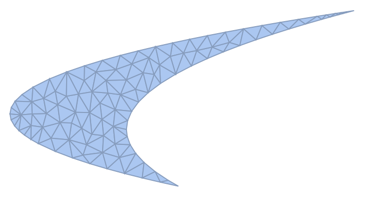
enter image description here

I'm not exactly sure what the message is about as this seems like a simple 2D region to me.

$\endgroup$
4
  • $\begingroup$ A trace shows that RegionPlot is calling RegionBounds with the "Finite" range type. This happens inside Graphics`Region`RegionDump`getBBoxFromRegion $\endgroup$ Commented Nov 9, 2016 at 17:08
  • $\begingroup$ I'm not sure if the bug is that "Minimal" should be used instead, or if "Finite" should do a better job of finding an interesting region. $\endgroup$ Commented Nov 9, 2016 at 17:12
  • 1
    $\begingroup$ @SimonWoods The reason why I went ahead and added the bug header was this post: mathematica.stackexchange.com/q/130744/12 It wasn't 100% clear to me if this was really a bug or if we're just expecting too much. $\endgroup$
    – Szabolcs
    Commented Nov 9, 2016 at 18:05
  • 1
    $\begingroup$ The documentation examples were fixed in 11.1.0 by replace RegionPlot with the new Region object. Unfortunately, RegionPlot hasn't gotten better at picking a sensible PlotRange. $\endgroup$ Commented Jul 24, 2017 at 5:25

Your Answer

By clicking “Post Your Answer”, you agree to our terms of service and acknowledge you have read our privacy policy.

Not the answer you're looking for? Browse other questions tagged or ask your own question.