4
$\begingroup$

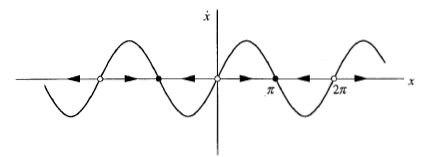
The differential equation I am trying to visualize the solution to is $\dot x=\sin x$. We can find the solutions to be $$-\ln|\csc x+\cot x|+C.$$ This result it correct, but hard to visualize. Looking at the original D.E., we see that the fixed points are $k\pi$, where $k\in\mathbb{Z}$. We have a 1-D phase plot here that allows use to see which of these fixed points are stable or unstable.

1-D Phase Plot for $\dot x$ above.

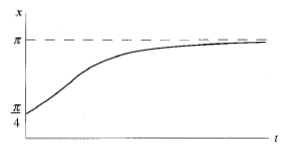
If we then graph $t$ against $x$ to see what happens as $t$ gets large, we get information about our solution more easily than looking at the solutions itself:

Here is a plot with initial condition $x_0=\pi/4$:

enter image description here

Moreover, I'm trying to plot many solutions with different initial conditions over the vector field associated with the D.E.

I've been trying for a while, and cannot figure out how to plot the vector field and a select collection of initial conditions on one graph.

Any ideas?

$\endgroup$
1

3 Answers 3

5
$\begingroup$

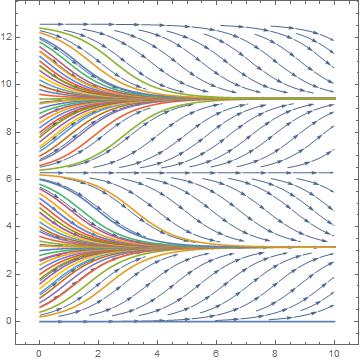
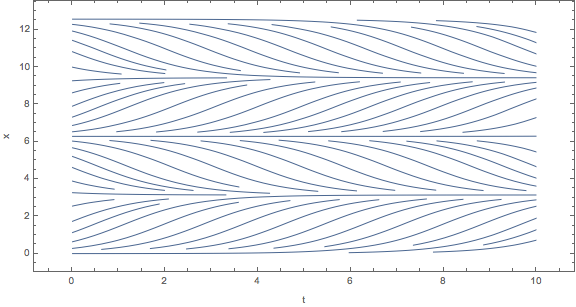
Combining Chris K and Nasser ideas, we can have something more appealing,

soln[x0_?NumericQ]:=First@NDSolve[{x'[t] == Sin[x[t]], x[0] == x0}, {x}, {t, 0, 10}];
vp = StreamPlot[{1, Sin[x]}, {t, 0, 10}, {x, 0, 4 \[Pi]}];
Show[vp, Plot[Evaluate[{x[t]} /. soln[#] & /@ Range[0, 4 \[Pi], 0.2]], {t, 0, 10},
   PlotRange -> All, MaxRecursion -> 8, AxesLabel -> {"x", "y"}]]

enter image description here

Same type question has been answered here.

$\endgroup$
3
$\begingroup$

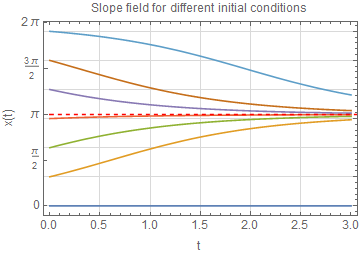
one way:

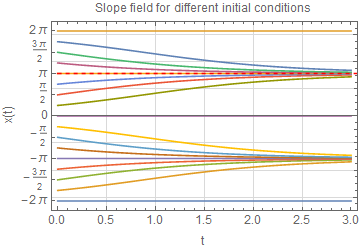
s[r_?NumericQ] := NDSolve[{x'[t] == Sin[x[t]], x[0] == r}, x, {t, 0, 3}];

p1 = Plot[Evaluate[  x[t] /. (s[#] & /@ Range[0, 6, 1])], {t, 0, 3}, 
   PlotRange -> Full, Frame -> True, 
   FrameLabel -> {{"x(t)", None}, {"t", "Slope field for different initial conditions"}}, 
   GridLines -> Automatic, GridLinesStyle -> LightGray, 
   BaseStyle -> 12, 
   FrameTicks -> {{Range[0, 2 Pi, Pi/2], Automatic}, Automatic}];

p2 = Plot[Pi, {t, 0, 6}, PlotStyle -> {Dashed, Red}];
Show[p1, p2]

Mathematica graphics

Reference Belisarius answer in how-can-i-plot-the-direction-field-for-a-differential-equation

Update

Thanks to suggestion by JM, here is solution using ParametricNDSolve which seems easier than the above. The parameter is the initial condition (i.e. x(0)=a where a here is the parameter.

sol = ParametricNDSolve[{x'[t] == Sin[x[t]], x[0] == a}, x, {t, 0, 3}, {a}];
p1 = Plot[
   Evaluate[Table[x[a][t] /. sol, {a, -2 Pi, 2 Pi, Pi/4}]], {t, 0, 3},
    PlotRange -> Full, Frame -> True, 
   FrameLabel -> {{"x(t)", None}, {"t", "Slope field for different initial conditions"}}, 
   GridLines -> Automatic, GridLinesStyle -> LightGray, 
   BaseStyle -> 12, 
   FrameTicks -> {{Range[-2 Pi, 2 Pi, Pi/2], Automatic}, Automatic}];

p2 = Plot[Pi, {t, 0, 6}, PlotStyle -> {Dashed, Red}];
Show[p1, p2]

Mathematica graphics

$\endgroup$
2
  • 1
    $\begingroup$ ParametricNDSolve[] might be more convenient here. $\endgroup$ Commented Feb 1, 2017 at 22:05
  • $\begingroup$ @J.M. thanks, will look into that. I have not used ParametricNDSolve[] myself before. $\endgroup$
    – Nasser
    Commented Feb 1, 2017 at 22:10
2
$\begingroup$

For the vector fields, how about:

StreamPlot[{1, Sin[x]}, {t, 0, 10}, {x, 0, 4 \[Pi]}, ImageSize -> Large,
   AspectRatio -> 0.5, StreamScale -> None, FrameLabel -> {"t", "x"}]

Mathematica graphics

For the 1D phase line plot, see here and especially @C.E.'s answer here.

$\endgroup$

Your Answer

By clicking “Post Your Answer”, you agree to our terms of service and acknowledge you have read our privacy policy.

Not the answer you're looking for? Browse other questions tagged or ask your own question.