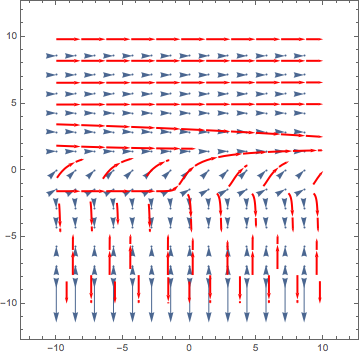
I am having trouble trying to plot solution curves onto a vector field for this certain ODE. I have tried plotting with multiple different initial conditions/ different constants however I keep getting a blank graph.
eq1 = y'[x] == E^(-y[x])*Cos[y[x]];

sol1b = DSolve[eq1, y[x], x] /. C[1] -> c

   {{y[x] ->
   InverseFunction[(1 - I) E^((1 + I) #1)
        Hypergeometric2F1[1/2 - I/2, 1, 3/2 - I/2, -E^(2 I #1)] &][
    c + x]}}


vf1 = VectorPlot[{1, E^(-y)*Cos[y]}, {x, -10, 10}, {y, -10, 10},
   VectorScale -> {Large, 1/2, Automatic}];


p2b = Plot[
  Evaluate[Table[y[x] /. sol1b, {c, 0, 10, 1}]], {x, -10, 10},
  PlotRange -> All]

Show[vf1, p2b]
This was my latest attempt. The vector field comes out great, it is my p2b plot that is causing problems. I'm guessing this has something to do with InverseFunction, but I really have no idea. I have tried lots of tricks from other posts but nothing seems to be working. Any suggestions ?

